## Line Charts: Accuracy vs. Number of Operations with Varying Pause Tokens
### Overview
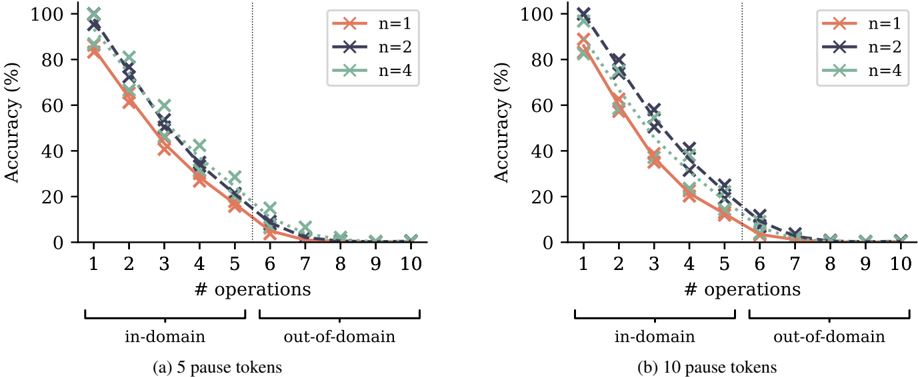
The image contains two side-by-side line charts, labeled (a) and (b), which plot model accuracy (as a percentage) against the number of sequential operations performed. The charts compare performance for three different model configurations (n=1, n=2, n=4) and distinguish between "in-domain" and "out-of-domain" tasks. The primary variable between the two charts is the number of "pause tokens" used: 5 in chart (a) and 10 in chart (b).
### Components/Axes
* **Chart Type:** Two line charts with markers.
* **Y-Axis (Both Charts):** Label: "Accuracy (%)". Scale: 0 to 100, with major ticks at 0, 20, 40, 60, 80, 100.
* **X-Axis (Both Charts):** Label: "# operations". Scale: 1 to 10, with integer ticks.
* **Legend (Both Charts):** Located in the top-right corner of each plot area.
* Orange line with 'x' markers: `n=1`
* Dark blue/purple dashed line with 'x' markers: `n=2`
* Green dotted line with 'x' markers: `n=4`
* **Domain Separation:** A vertical dotted gray line at x=5.5 on both charts separates the x-axis into two regions, annotated below the axis:
* Left of the line (operations 1-5): "in-domain"
* Right of the line (operations 6-10): "out-of-domain"
* **Subplot Titles/Captions:**
* Chart (a) (Left): "(a) 5 pause tokens"
* Chart (b) (Right): "(b) 10 pause tokens"
### Detailed Analysis
**Chart (a): 5 pause tokens**
* **Trend Verification:** All three data series show a steep, monotonic decline in accuracy as the number of operations increases. The decline is most severe in the "out-of-domain" region.
* **Data Series n=1 (Orange, solid line):**
* Starts at ~85% accuracy for 1 operation.
* Drops to ~65% at 2 ops, ~45% at 3 ops, ~30% at 4 ops, ~18% at 5 ops.
* In the out-of-domain region: ~5% at 6 ops, ~2% at 7 ops, and approaches 0% for 8-10 ops.
* **Data Series n=2 (Dark blue, dashed line):**
* Starts highest at ~95% for 1 operation.
* Drops to ~80% at 2 ops, ~55% at 3 ops, ~40% at 4 ops, ~25% at 5 ops.
* In the out-of-domain region: ~10% at 6 ops, ~5% at 7 ops, and near 0% for 8-10 ops.
* **Data Series n=4 (Green, dotted line):**
* Starts at ~90% for 1 operation.
* Drops to ~80% at 2 ops, ~60% at 3 ops, ~45% at 4 ops, ~30% at 5 ops.
* In the out-of-domain region: ~15% at 6 ops, ~5% at 7 ops, and near 0% for 8-10 ops.
* **Relative Performance:** For 1-5 operations (in-domain), the order of performance is generally n=2 > n=4 > n=1. The gap between them narrows as operations increase. In the out-of-domain region, all models perform very poorly, with n=4 showing a slight, brief advantage at 6 operations.
**Chart (b): 10 pause tokens**
* **Trend Verification:** Identical overall trend to chart (a): a steep, monotonic decline in accuracy with increasing operations.
* **Data Series n=1 (Orange, solid line):**
* Starts at ~90% for 1 operation.
* Drops to ~60% at 2 ops, ~38% at 3 ops, ~22% at 4 ops, ~12% at 5 ops.
* In the out-of-domain region: ~3% at 6 ops, ~1% at 7 ops, and 0% for 8-10 ops.
* **Data Series n=2 (Dark blue, dashed line):**
* Starts at ~100% for 1 operation.
* Drops to ~80% at 2 ops, ~55% at 3 ops, ~35% at 4 ops, ~20% at 5 ops.
* In the out-of-domain region: ~8% at 6 ops, ~2% at 7 ops, and 0% for 8-10 ops.
* **Data Series n=4 (Green, dotted line):**
* Starts at ~95% for 1 operation.
* Drops to ~80% at 2 ops, ~60% at 3 ops, ~40% at 4 ops, ~25% at 5 ops.
* In the out-of-domain region: ~12% at 6 ops, ~3% at 7 ops, and 0% for 8-10 ops.
* **Relative Performance:** The pattern is similar to chart (a). n=2 starts highest, followed closely by n=4, with n=1 starting lower. The performance hierarchy is maintained through the in-domain tasks, but all converge to near-zero accuracy in the out-of-domain region.
### Key Observations
1. **Universal Performance Degradation:** Accuracy for all models (n=1,2,4) and both pause token settings degrades rapidly and monotonically as the number of sequential operations increases.
2. **Sharp Domain Boundary:** There is a catastrophic drop in performance once the task moves from "in-domain" (operations 1-5) to "out-of-domain" (operations 6-10). Accuracy plummets to single digits or zero immediately after the boundary.
3. **Model Comparison (n-value):** Models with higher `n` (n=2, n=4) consistently outperform the n=1 model, especially for a lower number of operations. The n=2 model often shows the highest initial accuracy.
4. **Effect of Pause Tokens:** Comparing (a) and (b), increasing pause tokens from 5 to 10 appears to slightly improve the starting accuracy for n=1 and n=4 at 1 operation, but does not change the fundamental trend of rapid degradation or the out-of-domain collapse.
### Interpretation
The data demonstrates a severe limitation in the models' ability to perform long, sequential reasoning chains. The steep negative slope indicates that each additional operation introduces significant error accumulation, leading to a rapid loss of accuracy.
The stark "in-domain" vs. "out-of-domain" divide suggests the models are not performing robust, generalizable reasoning. Instead, they likely rely on pattern recognition or heuristics that work for shorter sequences (1-5 steps) seen during training but completely fail when extrapolated to longer sequences (6-10 steps), even if the operations are of the same type. This is a classic sign of poor generalization beyond the training distribution.
The advantage of higher `n` (which may represent a model size, ensemble size, or number of reasoning steps considered) provides a buffer against error for in-domain tasks but is insufficient to overcome the fundamental generalization failure in the out-of-domain regime. The number of pause tokens has a marginal effect, indicating that simply giving the model more "thinking time" or intermediate steps does not solve the core problem of compositional generalization for long sequences. The charts highlight a critical challenge in building systems that can reliably perform multi-step reasoning.