## Line Graphs: Accuracy vs. Number of Operations with Pause Tokens
### Overview
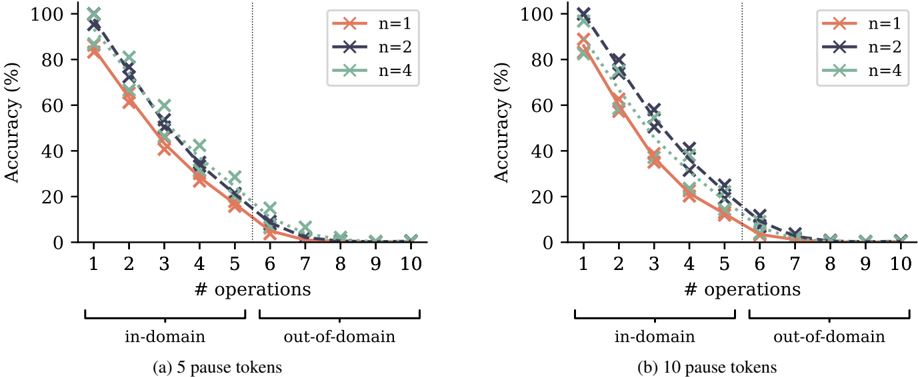
The image contains two line graphs (a and b) comparing model accuracy (%) against the number of operations (1–10) for in-domain and out-of-domain tasks. Each graph represents different numbers of pause tokens (n=1, n=2, n=4). Accuracy declines as operations increase, with distinct trends for in-domain and out-of-domain performance.
### Components/Axes
- **X-axis**: "# operations" (1–10), split into "in-domain" (1–5.5) and "out-of-domain" (5.5–10) by a vertical dashed line.
- **Y-axis**: "Accuracy (%)" (0–100).
- **Legends**:
- Top-right corner, with colors:
- Red (`n=1`)
- Blue (`n=2`)
- Green (`n=4`)
- **Graph Labels**:
- (a) "5 pause tokens"
- (b) "10 pause tokens"
### Detailed Analysis
#### Graph (a): 5 Pause Tokens
- **In-domain**:
- **n=1 (red)**: Starts at ~85% (1 op), drops to ~60% (3 ops), ~35% (5 ops), ~20% (7 ops), ~5% (10 ops).
- **n=2 (blue)**: Starts at ~90% (1 op), ~70% (3 ops), ~45% (5 ops), ~25% (7 ops), ~10% (10 ops).
- **n=4 (green)**: Starts at ~80% (1 op), ~60% (3 ops), ~30% (5 ops), ~15% (7 ops), ~5% (10 ops).
- **Out-of-domain**:
- **n=1 (red)**: Starts at ~75% (1 op), ~50% (3 ops), ~25% (5 ops), ~10% (7 ops), ~2% (10 ops).
- **n=2 (blue)**: Starts at ~85% (1 op), ~65% (3 ops), ~35% (5 ops), ~15% (7 ops), ~3% (10 ops).
- **n=4 (green)**: Starts at ~70% (1 op), ~45% (3 ops), ~20% (5 ops), ~8% (7 ops), ~2% (10 ops).
#### Graph (b): 10 Pause Tokens
- **In-domain**:
- **n=1 (red)**: Starts at ~90% (1 op), ~75% (3 ops), ~50% (5 ops), ~30% (7 ops), ~10% (10 ops).
- **n=2 (blue)**: Starts at ~95% (1 op), ~80% (3 ops), ~60% (5 ops), ~40% (7 ops), ~15% (10 ops).
- **n=4 (green)**: Starts at ~85% (1 op), ~65% (3 ops), ~40% (5 ops), ~25% (7 ops), ~5% (10 ops).
- **Out-of-domain**:
- **n=1 (red)**: Starts at ~80% (1 op), ~60% (3 ops), ~30% (5 ops), ~10% (7 ops), ~2% (10 ops).
- **n=2 (blue)**: Starts at ~85% (1 op), ~65% (3 ops), ~35% (5 ops), ~15% (7 ops), ~3% (10 ops).
- **n=4 (green)**: Starts at ~75% (1 op), ~50% (3 ops), ~25% (5 ops), ~10% (7 ops), ~2% (10 ops).
### Key Observations
1. **Pause Token Impact**: Higher `n` (pause tokens) correlates with higher accuracy, especially in in-domain tasks.
2. **In-Domain vs. Out-of-Domain**: In-domain accuracy is consistently higher than out-of-domain for all `n`.
3. **Decline Rate**: Accuracy drops faster for lower `n` (e.g., n=1 declines ~80% from 1 to 10 ops in in-domain).
4. **Threshold**: The split at 5.5 operations suggests a performance threshold where out-of-domain accuracy sharply declines.
### Interpretation
The data demonstrates that increasing pause tokens (`n`) improves model robustness, particularly in in-domain scenarios. Out-of-domain performance is more sensitive to operational complexity, with accuracy decaying faster as operations increase. The vertical split at 5.5 operations may indicate a critical point where the model’s ability to generalize diminishes, highlighting the importance of pause tokens in maintaining stability during extended operations. The steeper decline for lower `n` suggests that insufficient pause tokens exacerbate overfitting or instability in dynamic tasks.