## Heatmap: Layer vs. Token
### Overview
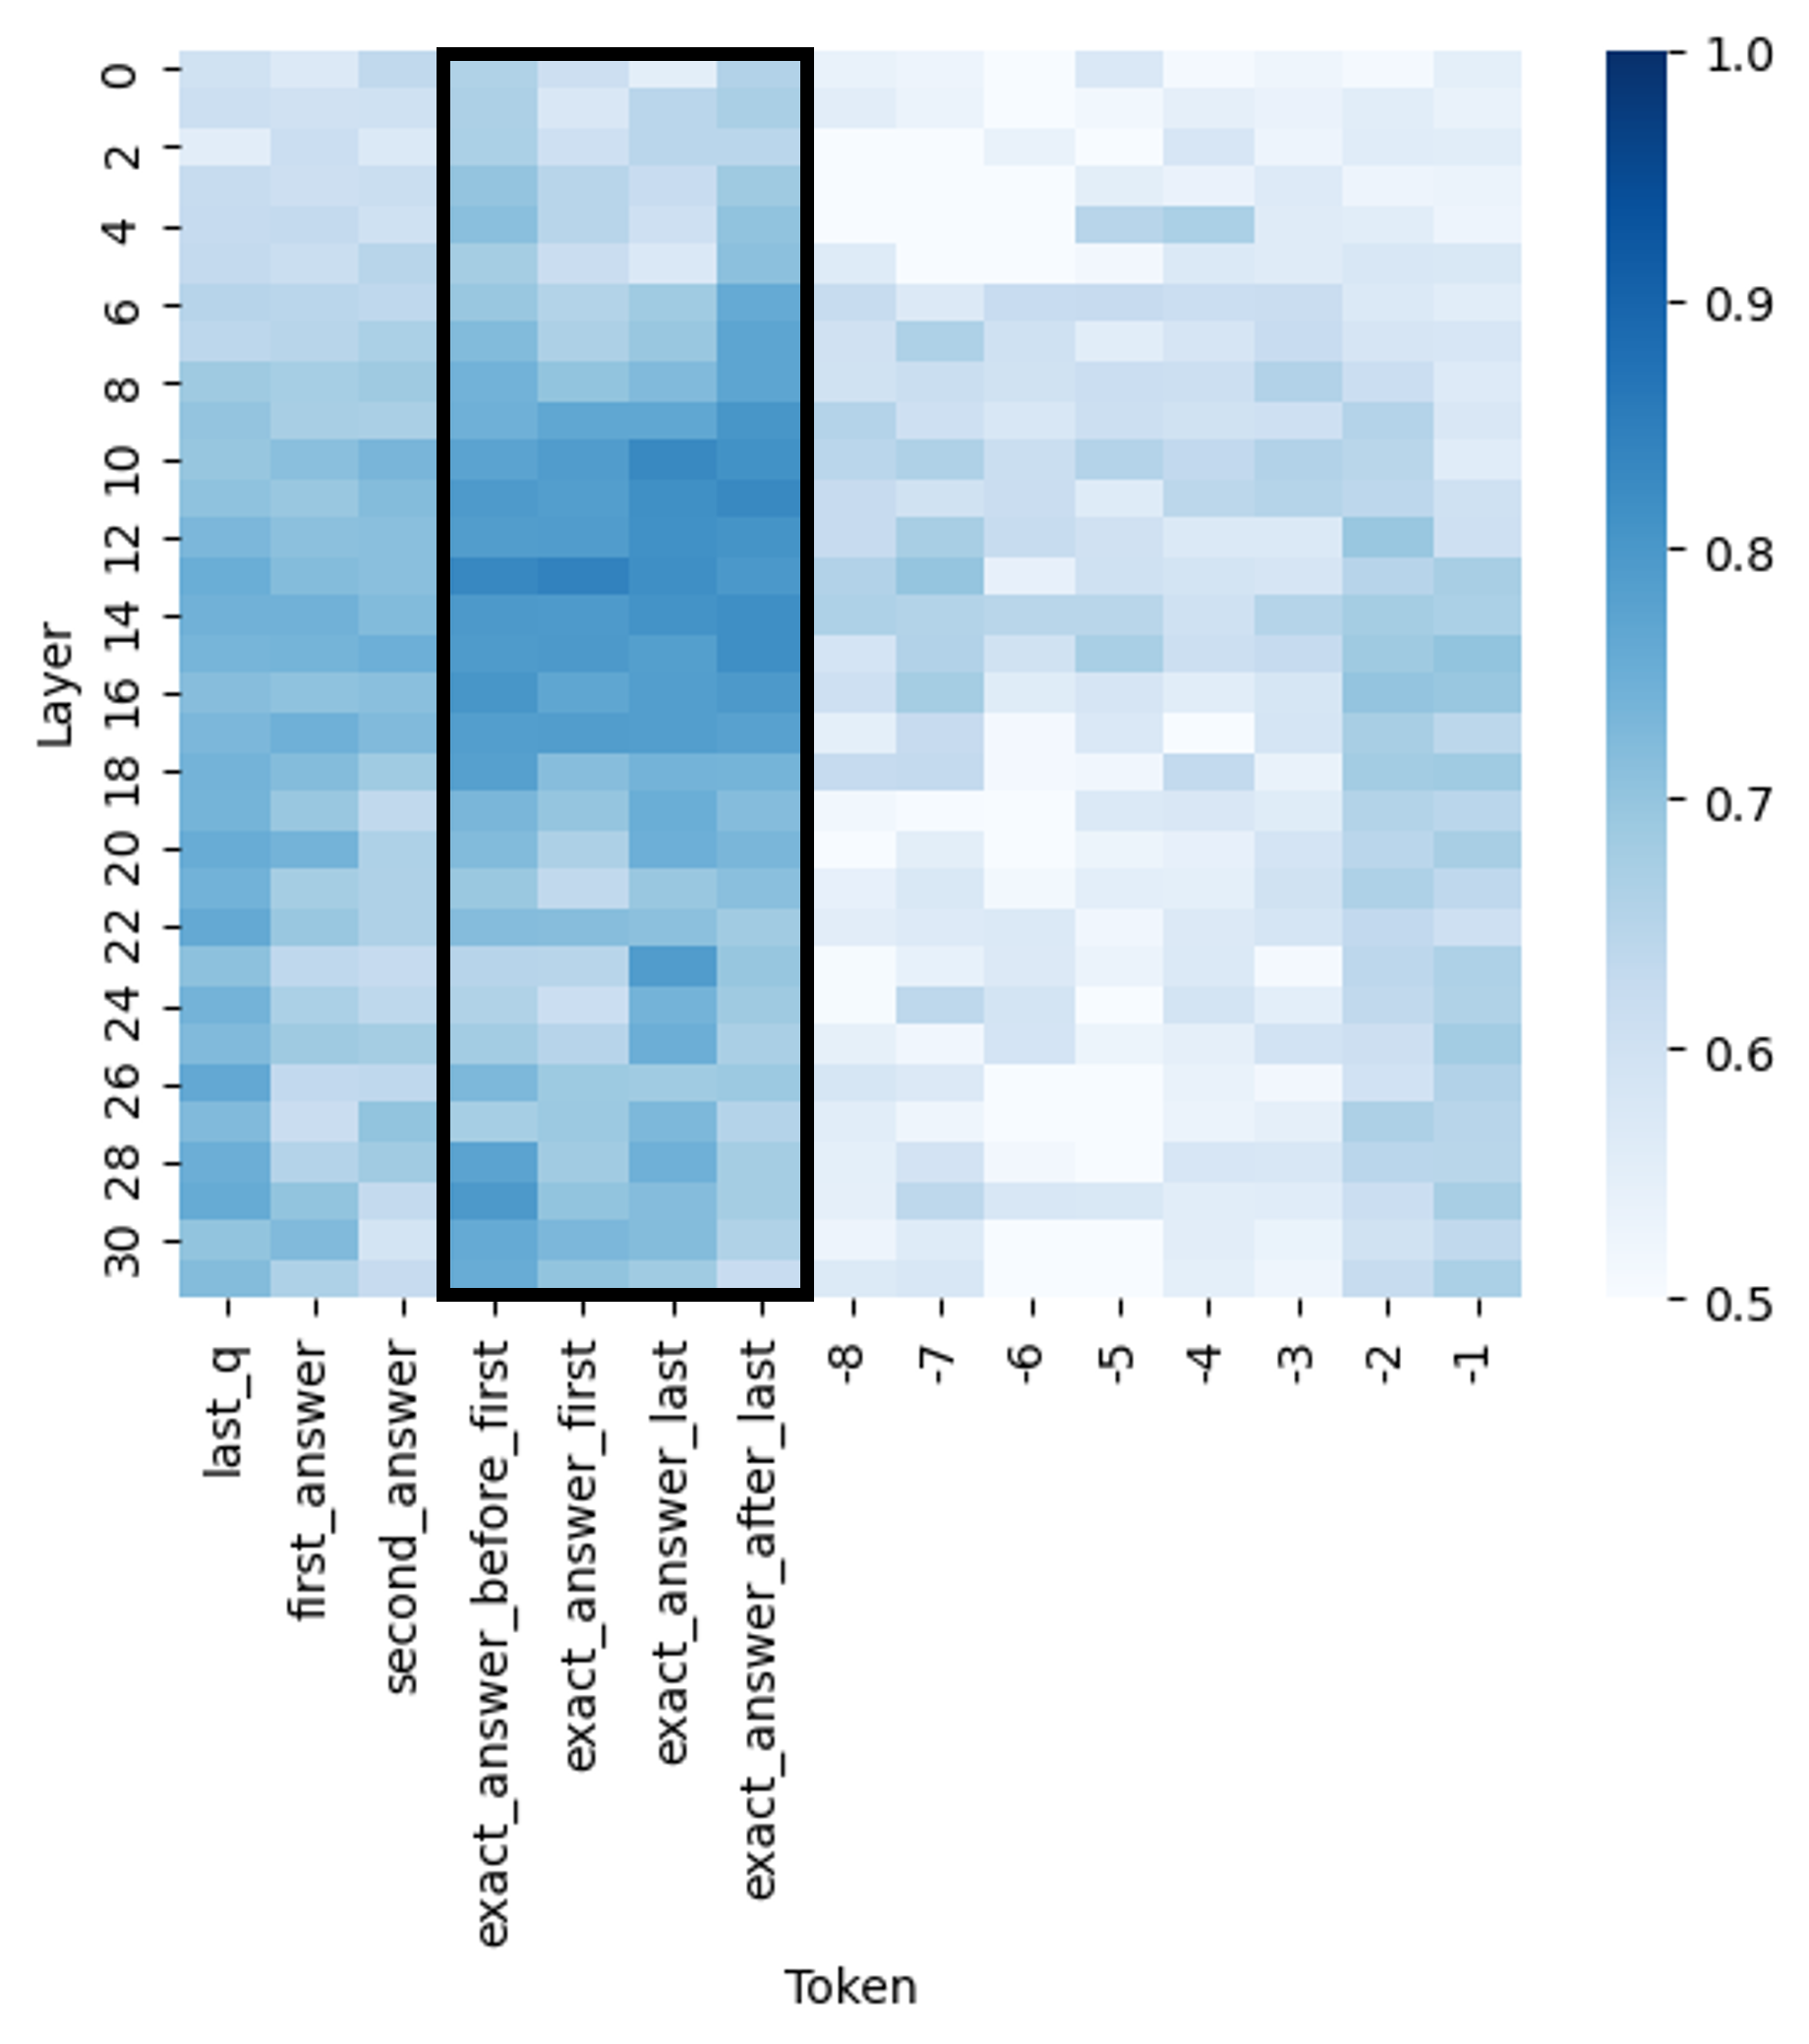
The image is a heatmap visualizing the relationship between "Layer" and "Token". The color intensity represents a value, with darker blue indicating higher values and lighter blue indicating lower values. The heatmap spans layers 0 to 30 and various tokens, including "last_q", "first_answer", "second_answer", "exact_answer_before_first", "exact_answer_first", "exact_answer_last", "exact_answer_after_last", and numerical tokens from -8 to -1.
### Components/Axes
* **X-axis (Token):** Categorical, listing tokens: "last\_q", "first\_answer", "second\_answer", "exact\_answer\_before\_first", "exact\_answer\_first", "exact\_answer\_last", "exact\_answer\_after\_last", "-8", "-7", "-6", "-5", "-4", "-3", "-2", "-1".
* **Y-axis (Layer):** Numerical, ranging from 0 to 30 in increments of 2.
* **Color Scale:** A gradient from light blue (approximately 0.5) to dark blue (1.0), indicating the value associated with each cell in the heatmap.
### Detailed Analysis
The heatmap displays varying intensities of blue, indicating different values for each layer-token combination.
* **"last\_q", "first\_answer", "second\_answer":** These tokens show relatively high values (darker blue) across most layers, especially from layer 0 to approximately layer 20. The values seem to decrease slightly in the higher layers (20-30).
* **"exact\_answer\_before\_first", "exact\_answer\_first", "exact\_answer\_last", "exact\_answer\_after\_last":** These tokens exhibit a band of high values (darker blue) concentrated between approximately layers 8 and 18. Outside this band, the values are generally lower (lighter blue).
* **Numerical Tokens (-8 to -1):** These tokens generally show lower values (lighter blue) across all layers compared to the other tokens. There are some localized areas of slightly higher values, but overall, the intensity is less.
### Key Observations
* The tokens related to "exact\_answer" exhibit a distinct band of high values in the middle layers (8-18).
* The initial tokens ("last\_q", "first\_answer", "second\_answer") have higher values in the lower layers, gradually decreasing as the layer number increases.
* The numerical tokens (-8 to -1) generally have the lowest values across all layers.
### Interpretation
The heatmap likely represents the activation or importance of different tokens across various layers of a neural network model, possibly a transformer model used for question answering.
* The high values for "last\_q", "first\_answer", and "second\_answer" in the lower layers suggest that these tokens are important for initial processing and understanding of the question.
* The concentration of high values for "exact\_answer" tokens in the middle layers indicates that these layers are crucial for identifying and processing the exact answer within the context.
* The lower values for numerical tokens might indicate that these tokens are less relevant for the specific task or model being analyzed.
The distinct patterns observed in the heatmap suggest that different layers of the model specialize in processing different types of tokens, contributing to the overall question-answering process. The black box highlights the "exact_answer" tokens, emphasizing their importance in the middle layers.