\n
## Heatmap: Layer vs. Token Correlation
### Overview
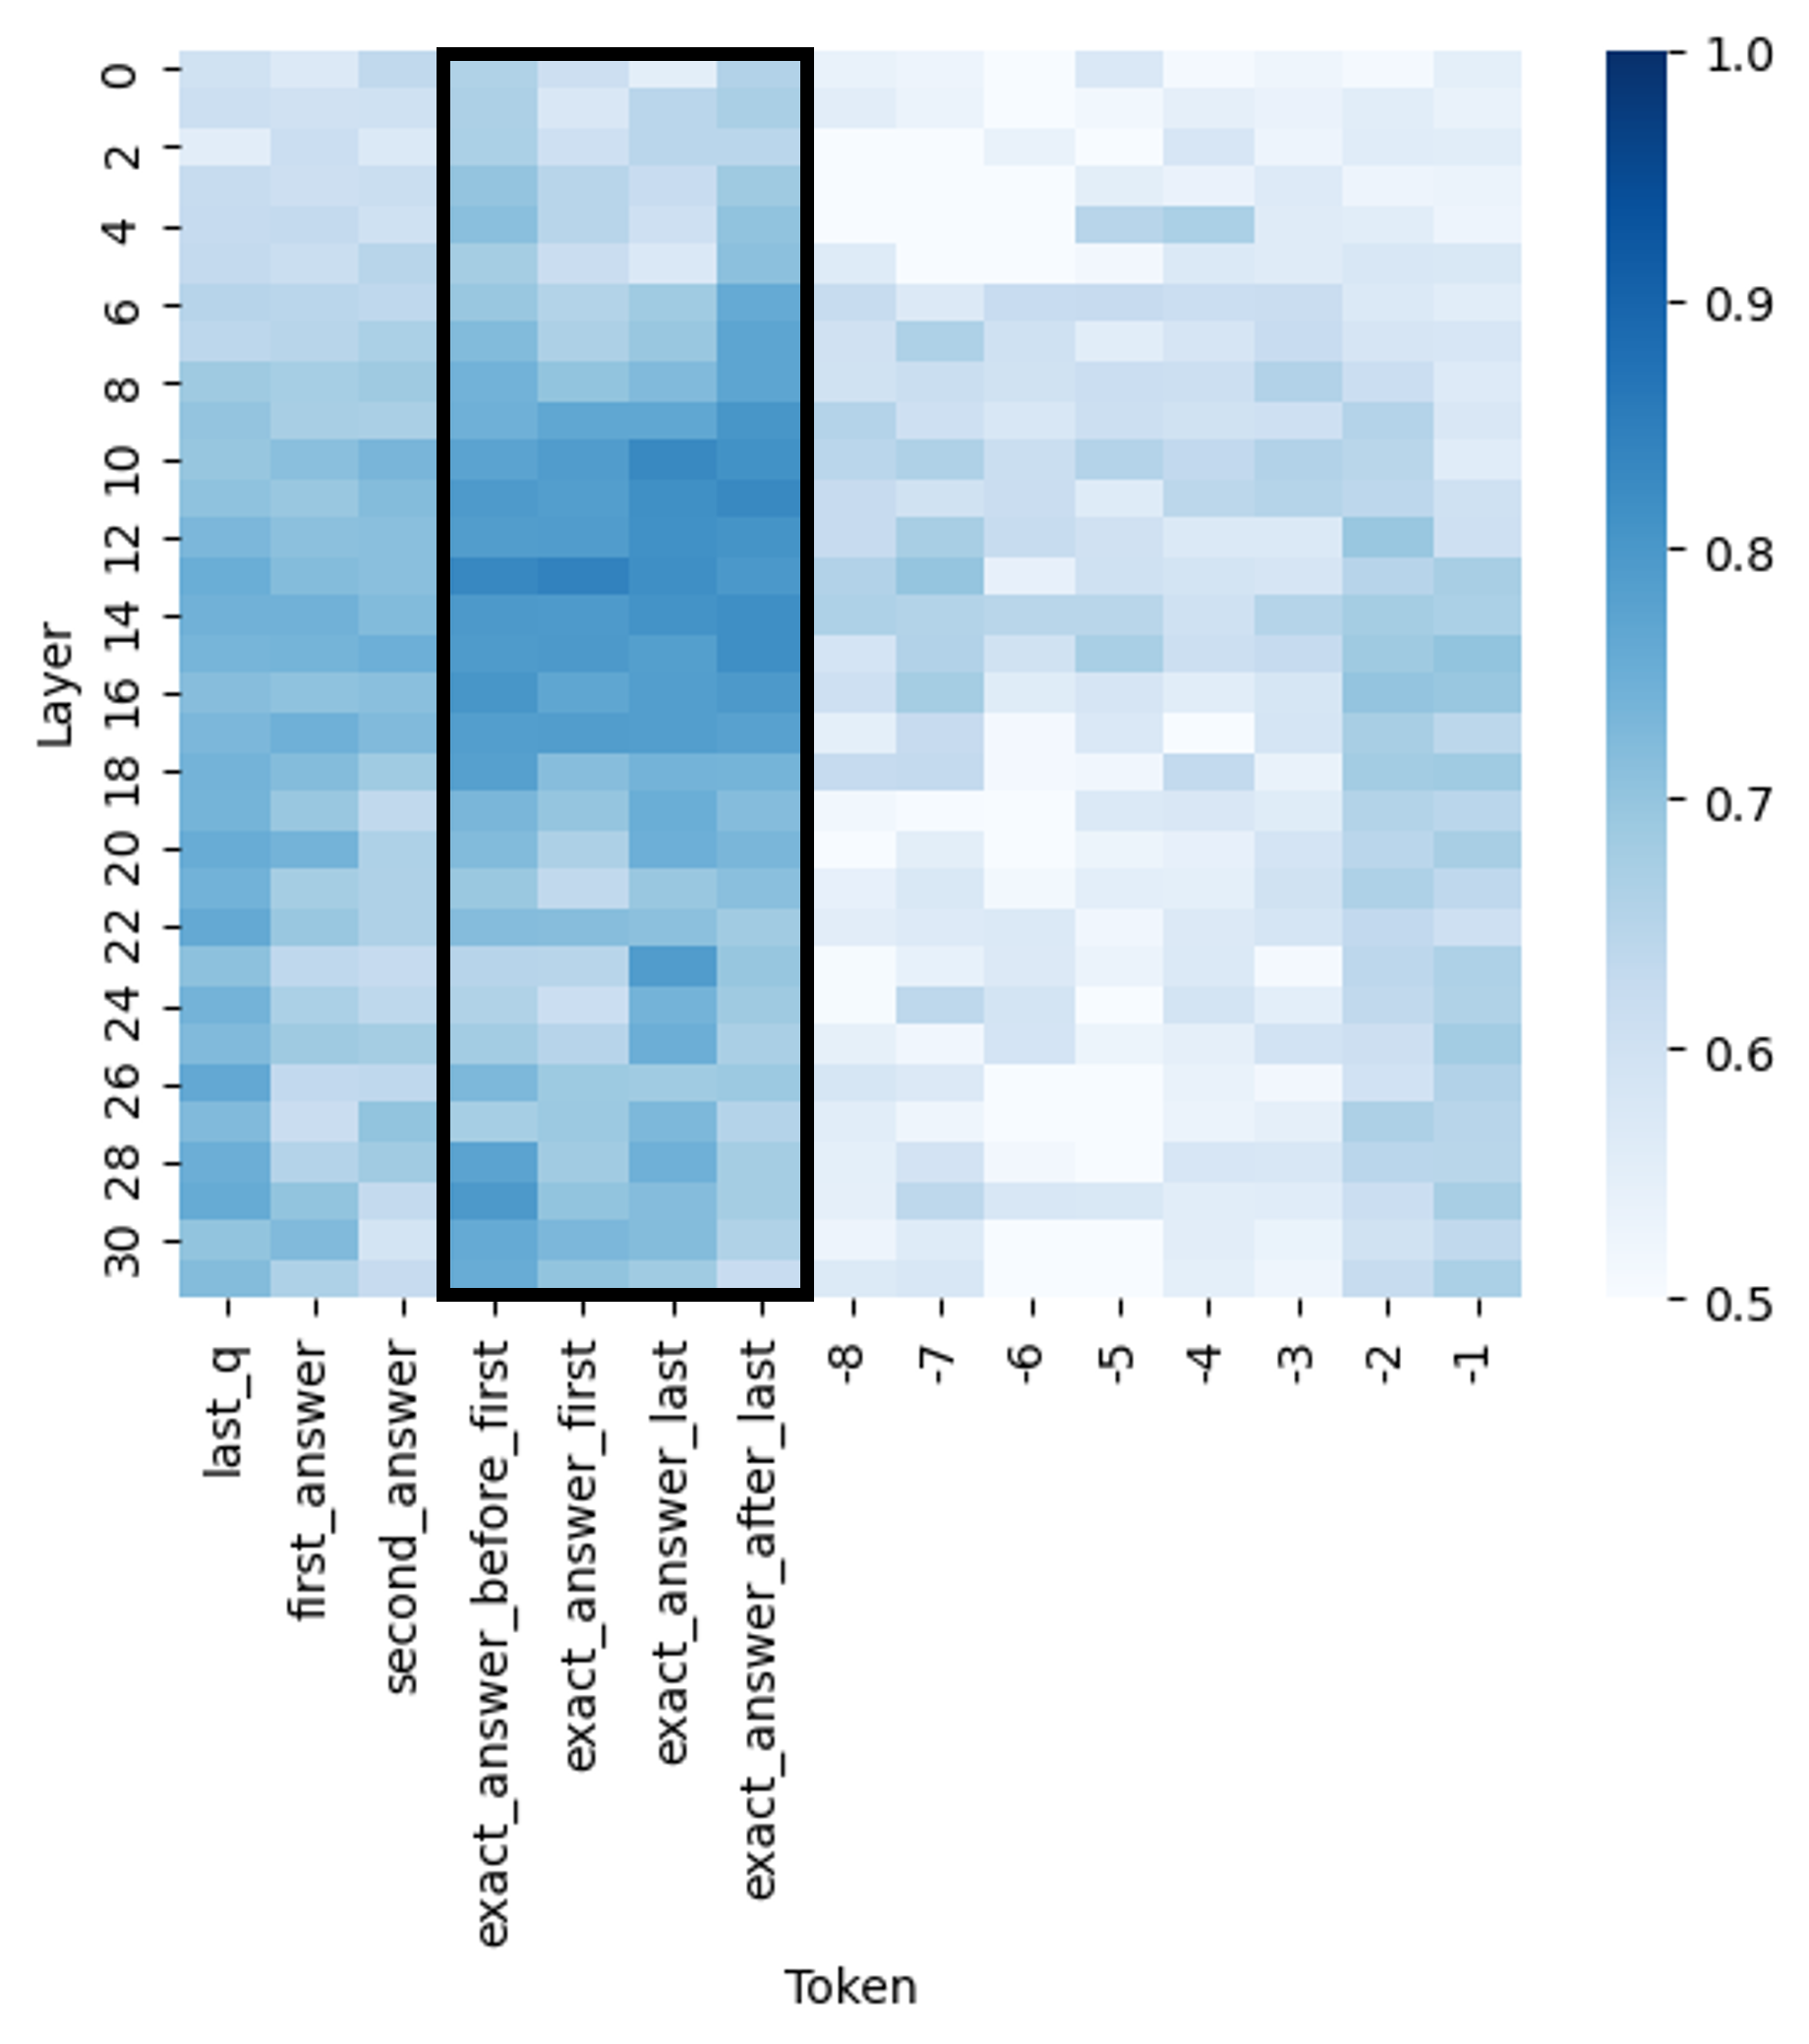
The image presents a heatmap visualizing the correlation between different layers of a model and various tokens. The heatmap uses a color gradient to represent correlation values, ranging from 0.5 (light blue) to 1.0 (dark blue). The x-axis represents tokens, and the y-axis represents layers.
### Components/Axes
* **X-axis (Horizontal):** "Token" with the following categories: "last\_q", "first\_answer", "second\_answer", "exact\_answer\_before\_first", "exact\_answer\_first", "exact\_answer\_last", "-8", "-7", "-6", "-5", "-4", "-3", "-2", "-1".
* **Y-axis (Vertical):** "Layer" ranging from 0 to 30, with increments of 2.
* **Color Scale (Right):** Represents correlation values.
* 0.5: Light Blue
* 0.6: Light-Medium Blue
* 0.7: Medium Blue
* 0.8: Medium-Dark Blue
* 0.9: Dark Blue
* 1.0: Very Dark Blue
* **Legend Position:** Top-right corner.
### Detailed Analysis
The heatmap shows varying degrees of correlation between layers and tokens. Here's a breakdown of observed values, noting approximate values due to the visual nature of the data:
* **Layer 0-4:** High correlation (approximately 0.9-1.0) with "first\_answer" and "second\_answer". Correlation decreases as we move towards "exact\_answer\_last" and the negative tokens.
* **Layer 6-8:** Maintains high correlation (approximately 0.8-0.9) with "first\_answer" and "second\_answer". A slight increase in correlation with "exact\_answer\_before\_first" and "exact\_answer\_first" is observed.
* **Layer 10-12:** Correlation with "first\_answer" and "second\_answer" remains high (approximately 0.8-0.9). Correlation with "exact\_answer\_first" and "exact\_answer\_last" increases to around 0.7-0.8.
* **Layer 14-16:** A peak in correlation (approximately 0.9-1.0) is observed with "exact\_answer\_first". Correlation with "first\_answer" and "second\_answer" decreases slightly to around 0.7-0.8.
* **Layer 18-20:** Correlation with "exact\_answer\_first" remains high (approximately 0.8-0.9). Correlation with the negative tokens (-8 to -1) begins to increase, reaching around 0.6-0.7.
* **Layer 22-24:** Correlation with "exact\_answer\_first" decreases to around 0.7-0.8. Correlation with the negative tokens continues to increase, reaching around 0.7-0.8 for -4 and -3.
* **Layer 26-28:** Correlation with "exact\_answer\_first" is around 0.6-0.7. Correlation with the negative tokens is relatively stable, around 0.6-0.7.
* **Layer 30:** Low correlation (approximately 0.5-0.6) across all tokens.
**Specific Data Points (Approximate):**
* Layer 0, "first\_answer": ~0.95
* Layer 0, "exact\_answer\_last": ~0.55
* Layer 14, "exact\_answer\_first": ~1.0
* Layer 18, "-4": ~0.65
* Layer 30, "last\_q": ~0.55
* Layer 30, "exact\_answer\_first": ~0.6
### Key Observations
* The highest correlations are generally observed between layers 0-16 and the "first\_answer" and "second\_answer" tokens.
* Correlation with "exact\_answer\_first" peaks around layer 14-16.
* Correlation with negative tokens (-8 to -1) increases with layer depth, peaking around layers 18-24.
* Layer 30 exhibits the lowest overall correlation with all tokens.
* The "last\_q" token consistently shows lower correlation values compared to the answer tokens.
### Interpretation
This heatmap likely represents the attention weights or activation patterns within a neural network model, specifically related to question answering. The strong correlation between early layers (0-16) and "first\_answer" and "second\_answer" suggests that these layers are crucial for initial answer generation. The peak in correlation with "exact\_answer\_first" around layer 14-16 indicates that this layer is particularly important for refining the answer towards a precise match.
The increasing correlation with negative tokens as the layer depth increases could indicate that later layers are involved in identifying and suppressing incorrect or irrelevant information. The low correlation in layer 30 suggests that this layer might be involved in a more global processing step or a final decision-making stage.
The relatively low correlation of "last\_q" across all layers might suggest that the model doesn't heavily rely on the initial question representation in later stages of processing, or that the question information is effectively integrated into the hidden states.
The heatmap provides valuable insights into how the model processes information at different layers and how different tokens contribute to the final answer. This information can be used to diagnose potential issues, optimize model architecture, and improve performance.