TECHNICAL ASSET FINGERPRINT
c2d549daafd5ede950cfc0a5
Click to view fullscreen
Press ESC or click to close
FOUND IN PAPERS
EXPERT: gemini-2.5-flash-lite-free VERSION 1
RUNTIME: google-free/gemini-2.5-flash-lite
INTEL_VERIFIED
## Heatmap: Token Attribution Analysis
### Overview
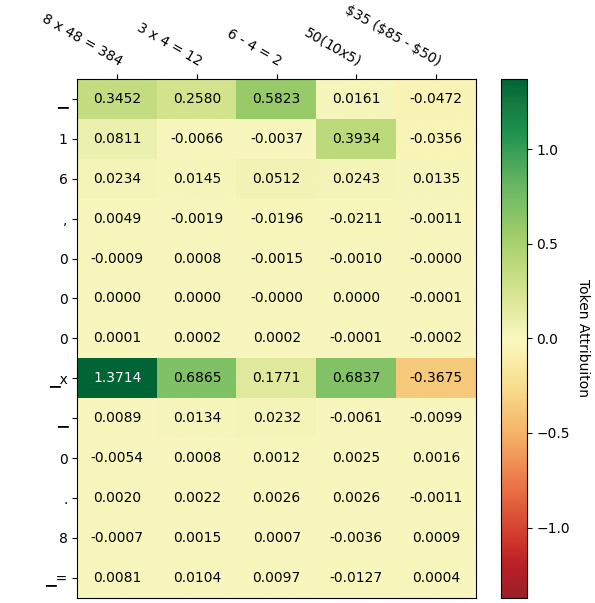
This image is a heatmap displaying token attribution values across different configurations or parameters. The heatmap uses a color gradient to represent the magnitude and sign of these attribution values, with a color bar indicating the scale from -1.0 (red) to 1.0 (green), with 0.0 represented by yellow. The rows and columns are labeled with what appear to be indices or specific token identifiers, and the columns are also grouped under distinct parameter settings.
### Components/Axes
**X-axis (Column Headers):**
The columns are grouped under the following labels:
* `8 x 48 = 384`
* `3 x 4 = 12`
* `6 - 4 = 2`
* `50(10x5)`
* `$35 ($85 - $50)`
**Y-axis (Row Headers):**
The rows are labeled with a series of characters and numbers. Some appear to be indices, while others might represent specific tokens or categories. The labels are:
* `-`
* `1`
* `6`
* `,`
* `0`
* `0`
* `0`
* `_x`
* `-`
* `0`
* `.`
* `8`
* `=`
**Color Bar (Legend):**
* **Title:** `Token Attributon` (Note: "Attribution" is misspelled as "Attributon")
* **Scale:** The color bar ranges from -1.0 (bottom, red) to 1.0 (top, dark green), with 0.0 in the middle (yellow). Intermediate values are represented by shades of orange, yellow, light green, and green.
### Detailed Analysis or Content Details
The heatmap contains numerical values within each cell, representing the token attribution. The color of each cell corresponds to the value it contains, as indicated by the color bar.
**Row `-`:**
* `8 x 48 = 384`: 0.3452 (Light Green)
* `3 x 4 = 12`: 0.2580 (Light Green)
* `6 - 4 = 2`: 0.5823 (Green)
* `50(10x5)`: 0.0161 (Yellow)
* `$35 ($85 - $50)`: -0.0472 (Yellow/Orange)
**Row `1`:**
* `8 x 48 = 384`: 0.0811 (Light Yellow/Green)
* `3 x 4 = 12`: -0.0066 (Yellow)
* `6 - 4 = 2`: -0.0037 (Yellow)
* `50(10x5)`: 0.3934 (Green)
* `$35 ($85 - $50)`: -0.0356 (Yellow)
**Row `6`:**
* `8 x 48 = 384`: 0.0234 (Yellow)
* `3 x 4 = 12`: 0.0145 (Yellow)
* `6 - 4 = 2`: 0.0512 (Light Green)
* `50(10x5)`: 0.0243 (Yellow)
* `$35 ($85 - $50)`: 0.0135 (Yellow)
**Row `,`:**
* `8 x 48 = 384`: 0.0049 (Yellow)
* `3 x 4 = 12`: -0.0019 (Yellow)
* `6 - 4 = 2`: -0.0196 (Yellow)
* `50(10x5)`: -0.0211 (Yellow)
* `$35 ($85 - $50)`: -0.0011 (Yellow)
**Row `0` (first instance):**
* `8 x 48 = 384`: -0.0009 (Yellow)
* `3 x 4 = 12`: 0.0008 (Yellow)
* `6 - 4 = 2`: -0.0015 (Yellow)
* `50(10x5)`: -0.0010 (Yellow)
* `$35 ($85 - $50)`: -0.0000 (Yellow)
**Row `0` (second instance):**
* `8 x 48 = 384`: 0.0000 (Yellow)
* `3 x 4 = 12`: 0.0000 (Yellow)
* `6 - 4 = 2`: -0.0000 (Yellow)
* `50(10x5)`: 0.0000 (Yellow)
* `$35 ($85 - $50)`: -0.0001 (Yellow)
**Row `0` (third instance):**
* `8 x 48 = 384`: 0.0001 (Yellow)
* `3 x 4 = 12`: 0.0002 (Yellow)
* `6 - 4 = 2`: 0.0002 (Yellow)
* `50(10x5)`: -0.0001 (Yellow)
* `$35 ($85 - $50)`: -0.0002 (Yellow)
**Row `_x`:**
* `8 x 48 = 384`: 1.3714 (Dark Green - **Outlier**)
* `3 x 4 = 12`: 0.6865 (Green)
* `6 - 4 = 2`: 0.1771 (Light Green)
* `50(10x5)`: 0.6837 (Green)
* `$35 ($85 - $50)`: -0.3675 (Orange)
**Row `-` (second instance):**
* `8 x 48 = 384`: 0.0089 (Yellow)
* `3 x 4 = 12`: 0.0134 (Yellow)
* `6 - 4 = 2`: 0.0232 (Yellow)
* `50(10x5)`: -0.0061 (Yellow)
* `$35 ($85 - $50)`: -0.0099 (Yellow)
**Row `0` (fourth instance):**
* `8 x 48 = 384`: -0.0054 (Yellow)
* `3 x 4 = 12`: 0.0008 (Yellow)
* `6 - 4 = 2`: 0.0012 (Yellow)
* `50(10x5)`: 0.0025 (Yellow)
* `$35 ($85 - $50)`: 0.0016 (Yellow)
**Row `.` (second instance):**
* `8 x 48 = 384`: 0.0020 (Yellow)
* `3 x 4 = 12`: 0.0022 (Yellow)
* `6 - 4 = 2`: 0.0026 (Yellow)
* `50(10x5)`: 0.0026 (Yellow)
* `$35 ($85 - $50)`: -0.0011 (Yellow)
**Row `8`:**
* `8 x 48 = 384`: -0.0007 (Yellow)
* `3 x 4 = 12`: 0.0015 (Yellow)
* `6 - 4 = 2`: 0.0007 (Yellow)
* `50(10x5)`: -0.0036 (Yellow)
* `$35 ($85 - $50)`: 0.0009 (Yellow)
**Row `=`:**
* `8 x 48 = 384`: 0.0081 (Yellow)
* `3 x 4 = 12`: 0.0104 (Yellow)
* `6 - 4 = 2`: 0.0097 (Yellow)
* `50(10x5)`: -0.0127 (Yellow)
* `$35 ($85 - $50)`: 0.0004 (Yellow)
### Key Observations
* **Dominance of Low Values:** The majority of the cells contain values very close to zero, predominantly represented by yellow. This suggests that for most row/column combinations, the token attribution is minimal.
* **Significant Positive Attribution:** The row labeled `_x` exhibits the highest positive attribution values, particularly under the `8 x 48 = 384` column, with a value of 1.3714. This is a clear outlier and indicates a strong positive attribution for this specific token/row under this configuration. Other strong positive attributions are observed in the `_x` row for `3 x 4 = 12` (0.6865) and `50(10x5)` (0.6837), and in the first row (`-`) for `6 - 4 = 2` (0.5823) and `8 x 48 = 384` (0.3452).
* **Significant Negative Attribution:** The only notable negative attribution is in the `_x` row under the `$35 ($85 - $50)` column, with a value of -0.3675. This is a moderate negative attribution.
* **Column Trends:**
* The `8 x 48 = 384` column shows a mix of low positive and negative values, with a single very high positive outlier (`_x`).
* The `3 x 4 = 12` column also shows mostly low values, with a strong positive value in the `_x` row.
* The `6 - 4 = 2` column has a few moderately positive values (e.g., 0.5823 in the first row, 0.1771 in the `_x` row) but is otherwise dominated by values near zero.
* The `50(10x5)` column shows a strong positive value in the `_x` row and a moderate positive value in row `1` (0.3934), with other values near zero.
* The `$35 ($85 - $50)` column generally shows values close to zero, with a moderate negative value in the `_x` row and a small negative value in the first row.
### Interpretation
This heatmap likely represents the results of an analysis where different input configurations (columns) are applied to a model, and the "token attribution" (y-axis labels) is measured. The values indicate how much each specific token (or token category represented by the y-axis labels) contributes to a particular outcome or prediction under each configuration.
* **High Attribution for `_x`:** The row labeled `_x` stands out significantly. The extremely high positive attribution under `8 x 48 = 384` suggests that this specific token is a very strong positive driver for whatever the model is predicting or calculating when using this configuration. The strong positive attributions in other columns for `_x` further emphasize its importance.
* **Negative Impact of `$35 ($85 - $50)` for `_x`:** Conversely, the negative attribution for `_x` under `$35 ($85 - $50)` indicates that this token might have an inhibitory or counteracting effect in this specific scenario.
* **General Low Attribution:** The prevalence of values close to zero across most cells implies that for many token-configuration pairs, the contribution is negligible. This could mean that the model is not sensitive to these tokens under those conditions, or that the configurations themselves do not strongly influence the attribution of these tokens.
* **Parameter Sensitivity:** The varying attribution values across different column headers (e.g., `8 x 48 = 384` vs. `$35 ($85 - $50)`) suggest that the model's behavior and the importance of specific tokens are sensitive to the input parameters or configurations. The column labels themselves appear to be derived from mathematical operations or pricing tiers, hinting at the nature of these configurations. For instance, `8 x 48 = 384` might represent a larger input size or a specific computational setting, while `$35 ($85 - $50)` could relate to a pricing strategy or a range of values.
In essence, the heatmap highlights that certain tokens (like `_x`) can have a disproportionately large impact on model outputs depending on the specific operational context or parameters being used. The analysis helps identify which tokens are most influential and under what conditions. The misspelling of "Attribution" as "Attributon" in the legend is a minor detail but worth noting for technical accuracy.
DECODING INTELLIGENCE...