\n
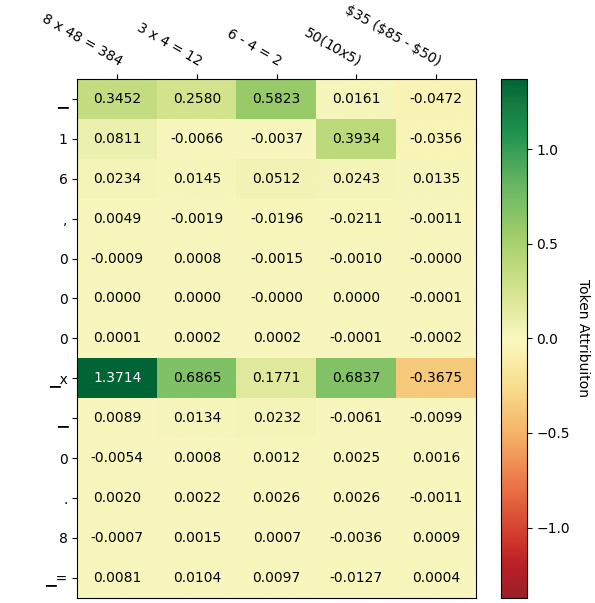
## Heatmap: Token Attribution
### Overview
The image presents a heatmap displaying "Token Attribution" values. The heatmap is a 9x5 grid, with labels indicating mathematical expressions along the top edge and symbols representing variables (x, =, -) along the left edge. The color scale ranges from -1.0 (dark red) to 1.0 (dark green), representing the strength of the attribution.
### Components/Axes
* **X-axis (Top):** Labeled with mathematical expressions: "8 x 48 = 384", "3 x 4 = 12", "6 - 4 = 2", "50 (10x5)", "$35 ($85 - $50)".
* **Y-axis (Left):** Labeled with symbols: "-", "1", "6", "0", "0", "0", "-x", "0", "8", "=".
* **Color Scale (Right):** Ranges from -1.0 (red) to 1.0 (green), with intermediate values at -0.5 and 0.5, and 0.0. Labeled "Token Attribution".
* **Grid:** 9 rows and 5 columns of colored cells, each representing a value.
### Detailed Analysis
The heatmap displays numerical values within each cell, corresponding to the intersection of the X and Y axis labels. Here's a breakdown of the values, row by row:
* **Row 1 (-):** 0.3452, 0.2580, 0.5823, 0.0161, -0.0472
* **Row 2 (1):** 0.0811, -0.0066, -0.0037, 0.3934, -0.0356
* **Row 3 (6):** 0.0234, 0.0145, 0.0512, 0.0243, 0.0135
* **Row 4 (0):** 0.0049, -0.0019, -0.0196, -0.0211, -0.0011
* **Row 5 (0):** 0.0000, 0.0000, -0.0000, 0.0000, -0.0001
* **Row 6 (0):** 0.0001, 0.0002, 0.0002, -0.0001, -0.0002
* **Row 7 (-x):** 1.3714, 0.6865, 0.1771, 0.6837, -0.3675
* **Row 8 (0):** 0.0089, 0.0134, 0.0232, -0.0061, -0.0099
* **Row 9 (8):** -0.0054, 0.0008, 0.0012, 0.0025, 0.0016
* **Row 10 (=):** -0.0007, 0.0015, 0.0007, -0.0036, 0.0009
* **Row 11 (=):** 0.0081, 0.0104, 0.0097, -0.0127, 0.0004
**Trends:**
* The "-x" row (row 7) exhibits the highest positive attribution values, particularly for "8 x 48 = 384" (1.3714) and "3 x 4 = 12" (0.6865).
* The expression "$35 ($85 - $50)" consistently shows negative attribution values across most rows.
* Rows labeled "0" generally have values close to zero.
* The values are generally small, with a few outliers.
### Key Observations
* The highest positive value is 1.3714, associated with "8 x 48 = 384" and "-x".
* The lowest negative value is -0.3675, associated with "$35 ($85 - $50)" and "-x".
* The heatmap shows a clear distinction between positive and negative attribution values, with the color gradient effectively representing the strength of the attribution.
* The mathematical expressions along the x-axis seem to have varying degrees of influence on the token attribution, as indicated by the different color intensities.
### Interpretation
This heatmap likely represents the attribution scores of different tokens (mathematical expressions) to a specific feature or concept represented by the rows (symbols). The higher the attribution score (closer to 1.0), the more strongly that token contributes to the feature. Conversely, negative attribution scores (closer to -1.0) indicate a negative contribution.
The strong positive attribution of "8 x 48 = 384" to "-x" suggests that this expression is highly relevant to the concept represented by "-x". The negative attribution of "$35 ($85 - $50)" across multiple rows indicates that this expression might be acting as a distractor or having an opposing effect.
The heatmap provides insights into the relationships between mathematical expressions and underlying concepts, potentially aiding in understanding the model's reasoning or identifying areas for improvement. The fact that many values are close to zero suggests that most expressions have a relatively weak attribution to the features being analyzed. The heatmap is a visualization of feature importance, showing which mathematical expressions are most influential in determining the values of the symbols.