## Chart/Diagram Type: Multiple Plots
### Overview
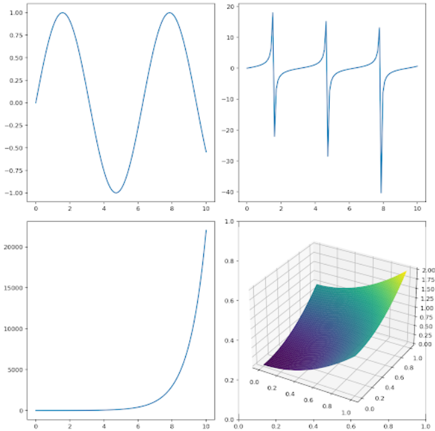
The image contains four separate plots arranged in a 2x2 grid. The plots showcase different mathematical functions or relationships. The top-left plot shows a sinusoidal function. The top-right plot shows a tangent-like function with asymptotes. The bottom-left plot shows an exponential function. The bottom-right plot shows a 3D surface plot.
### Components/Axes
**Top-Left Plot:**
* **X-axis:** Ranges from 0 to 10, with tick marks at intervals of 2.
* **Y-axis:** Ranges from -1.0 to 1.0, with tick marks at intervals of 0.25.
* **Data Series:** A sinusoidal curve in blue.
**Top-Right Plot:**
* **X-axis:** Ranges from 0 to 10, with tick marks at intervals of 2.
* **Y-axis:** Ranges from -40 to 20, with tick marks at intervals of 10.
* **Data Series:** A tangent-like function with vertical asymptotes, in blue.
**Bottom-Left Plot:**
* **X-axis:** Ranges from 0 to 10, with tick marks at intervals of 2.
* **Y-axis:** Ranges from 0 to 20000, with tick marks at 5000 intervals.
* **Data Series:** An exponential curve in blue.
**Bottom-Right Plot:**
* **X-axis:** Ranges from 0.0 to 1.0, with tick marks at intervals of 0.2.
* **Y-axis:** Ranges from 0.0 to 1.0, with tick marks at intervals of 0.2.
* **Z-axis:** Ranges from 0.00 to 2.00, with tick marks at intervals of 0.25.
* **Data Series:** A 3D surface plot, colored with a gradient from purple to yellow.
### Detailed Analysis or Content Details
**Top-Left Plot (Sinusoidal Function):**
* The blue line starts at approximately y=0 at x=0.
* The line reaches a maximum of approximately y=1 at x=2.5.
* The line reaches a minimum of approximately y=-1 at x=5.
* The line reaches a maximum of approximately y=1 at x=7.5.
* The line ends at approximately y=-0.5 at x=10.
**Top-Right Plot (Tangent-like Function):**
* The blue line has vertical asymptotes at approximately x=1.5, x=4.5, and x=7.5.
* The y-values approach positive and negative infinity near these asymptotes.
* The function appears periodic.
**Bottom-Left Plot (Exponential Function):**
* The blue line starts at approximately y=0 at x=0.
* The line increases slowly until approximately x=6.
* The line increases rapidly from x=6 to x=10, reaching approximately y=22000 at x=10.
**Bottom-Right Plot (3D Surface Plot):**
* The surface is colored with a gradient, with purple indicating lower values and yellow indicating higher values.
* The surface appears to be a curved plane, with the highest values in the top-right corner (x=1, y=1, z=2).
* The lowest values are in the bottom-left corner (x=0, y=0, z=0).
### Key Observations
* The top-left plot shows a periodic sinusoidal function.
* The top-right plot shows a periodic tangent-like function with asymptotes.
* The bottom-left plot shows an exponential function with rapid growth towards the end.
* The bottom-right plot shows a 3D surface that increases in value as both x and y increase.
### Interpretation
The image presents four different mathematical functions, each with distinct characteristics. The sinusoidal function demonstrates periodic oscillation, the tangent-like function shows periodic behavior with asymptotes, the exponential function illustrates rapid growth, and the 3D surface plot visualizes a function of two variables. The plots are likely used to demonstrate or analyze these functions in a mathematical or scientific context. The relationship between the plots is that they are all examples of different types of mathematical functions. There are no obvious outliers, but the rapid growth of the exponential function is notable.