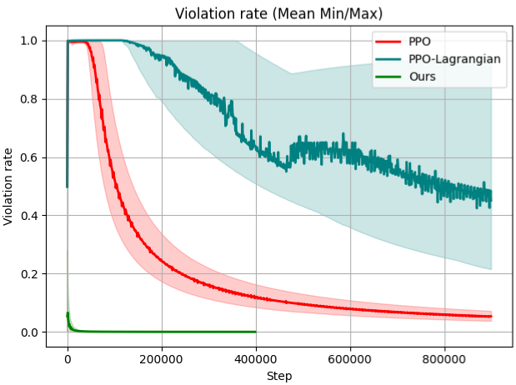
## Line Chart: Violation Rate (Mean Min/Max)
### Overview
The image is a line chart comparing the violation rates of three different algorithms: PPO (Proximal Policy Optimization), PPO-Lagrangian, and "Ours". The chart displays the violation rate on the y-axis against the step number on the x-axis. Each algorithm's performance is represented by a line, with shaded regions indicating the min/max range around the mean.
### Components/Axes
* **Title:** Violation rate (Mean Min/Max)
* **X-axis:** Step, with markers at 0, 200000, 400000, 600000, and 800000.
* **Y-axis:** Violation rate, with markers at 0.0, 0.2, 0.4, 0.6, 0.8, and 1.0.
* **Legend (Top-Right):**
* PPO (Red line with red shaded region)
* PPO-Lagrangian (Teal line with teal shaded region)
* Ours (Green line)
### Detailed Analysis
* **PPO (Red):**
* Trend: The violation rate starts at approximately 1.0 and rapidly decreases to around 0.2 by step 200000. It then gradually decreases further, reaching approximately 0.05 by step 800000.
* Data Points:
* Step 0: Violation rate ~ 1.0
* Step 200000: Violation rate ~ 0.2
* Step 400000: Violation rate ~ 0.12
* Step 600000: Violation rate ~ 0.08
* Step 800000: Violation rate ~ 0.05
* The red shaded region indicates the min/max range, which narrows as the step increases.
* **PPO-Lagrangian (Teal):**
* Trend: The violation rate starts at approximately 1.0 and gradually decreases to around 0.6 by step 800000. The line exhibits more fluctuations compared to the PPO line.
* Data Points:
* Step 0: Violation rate ~ 1.0
* Step 200000: Violation rate ~ 0.9
* Step 400000: Violation rate ~ 0.75
* Step 600000: Violation rate ~ 0.65
* Step 800000: Violation rate ~ 0.6
* The teal shaded region indicates the min/max range, which is wider than the PPO range, especially in the earlier steps.
* **Ours (Green):**
* Trend: The violation rate starts at approximately 1.0, rapidly decreases to near 0.0 within the first few steps, and remains close to 0.0 for the rest of the steps.
* Data Points:
* Step 0: Violation rate ~ 1.0
* Step ~10000: Violation rate ~ 0.0
* Step 800000: Violation rate ~ 0.0
* The green line is consistently near the x-axis, indicating a very low violation rate.
### Key Observations
* The "Ours" algorithm consistently achieves the lowest violation rate across all steps.
* The PPO algorithm shows a significant decrease in violation rate over time, outperforming PPO-Lagrangian.
* The PPO-Lagrangian algorithm has a higher and more variable violation rate compared to the other two algorithms.
* The min/max range for PPO-Lagrangian is wider than that of PPO, indicating greater variability in its performance.
### Interpretation
The chart demonstrates the performance of three different algorithms in terms of violation rate over a series of steps. The "Ours" algorithm appears to be the most effective in minimizing violations, as its violation rate quickly drops to near zero and remains there. The PPO algorithm also shows a significant reduction in violation rate, eventually outperforming the PPO-Lagrangian algorithm. The PPO-Lagrangian algorithm exhibits a higher and more variable violation rate, suggesting that it may be less stable or less effective in this particular context. The shaded regions provide insight into the variability of each algorithm's performance, with PPO-Lagrangian showing the widest range. Overall, the data suggests that the "Ours" algorithm is the preferred choice for minimizing violations, followed by PPO.