## Line Graph: Violation Rate (Mean Min/Max)
### Overview
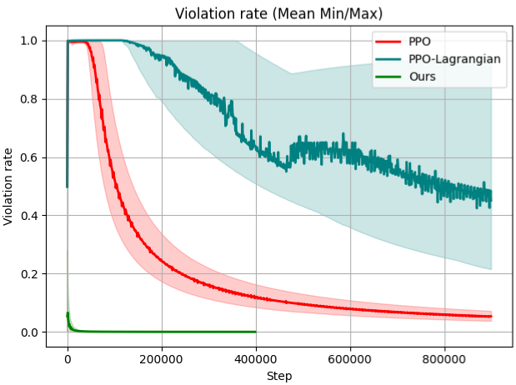
The graph compares the violation rate trends of three methods—PPO, PPO-Lagrangian, and "Ours"—over 800,000 steps. The y-axis represents violation rate (0.0 to 1.0), and the x-axis represents steps (0 to 800,000). Shaded regions around each line indicate variability (likely confidence intervals or error margins).
### Components/Axes
- **Title**: "Violation rate (Mean Min/Max)"
- **X-axis**: "Step" (0 to 800,000)
- **Y-axis**: "Violation rate" (0.0 to 1.0)
- **Legend**: Located in the top-right corner, with three entries:
- **Red**: PPO
- **Teal**: PPO-Lagrangian
- **Green**: Ours
- **Shaded Regions**:
- Red: PPO (narrower early, widening slightly later)
- Teal: PPO-Lagrangian (wider throughout, peaking around 400,000 steps)
- Green: Ours (no shading, indicating minimal variability)
### Detailed Analysis
1. **PPO (Red Line)**:
- Starts at 1.0 violation rate at step 0.
- Sharp decline to ~0.1 by 800,000 steps.
- Shaded region narrows significantly after ~200,000 steps, suggesting reduced uncertainty over time.
2. **PPO-Lagrangian (Teal Line)**:
- Begins at ~0.8 violation rate at step 0.
- Fluctuates between ~0.5 and ~0.8 for the first 400,000 steps, then stabilizes near ~0.5.
- Shaded region is consistently wider than PPO, peaking around 400,000 steps.
3. **"Ours" (Green Line)**:
- Remains near 0.0 violation rate throughout all steps.
- No shaded region, indicating near-zero variability.
### Key Observations
- **"Ours"** maintains the lowest and most stable violation rate (~0.0), outperforming both PPO and PPO-Lagrangian.
- **PPO** shows the steepest improvement but starts with the highest violation rate.
- **PPO-Lagrangian** has the highest variability (widest shaded region), especially in the first 400,000 steps.
- All methods show decreasing violation rates over time, but "Ours" achieves near-perfect performance immediately.
### Interpretation
The data suggests that the method labeled "Ours" is the most effective at minimizing violations, maintaining near-zero rates with minimal variability. PPO-Lagrangian, while better than PPO, exhibits significant fluctuations and higher uncertainty, particularly in early steps. PPO demonstrates the most dramatic improvement but starts with the worst performance. The shaded regions highlight that "Ours" is not only more effective but also more reliable, as its results are consistently stable. This could indicate superior algorithmic design or optimization in the "Ours" method compared to the others.