\n
## Bar and Line Chart: Accuracy vs. Epochs for Different Models
### Overview
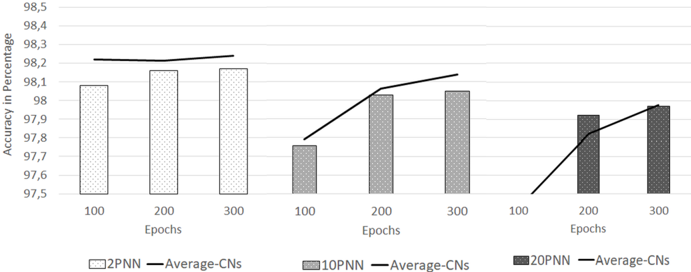
This chart compares the accuracy of three different models (2PNN, 10PNN, and 20PNN) over 300 epochs. Accuracy is measured in percentage, and the chart displays both the accuracy at specific epochs (100, 200, 300) using bar graphs and the average accuracy of Convolutional Neural Networks (CNs) over epochs using lines.
### Components/Axes
* **X-axis:** Epochs (labeled 100, 200, 300)
* **Y-axis:** Accuracy in Percentage (scale from 97.5 to 98.5)
* **Models:** 2PNN, 10PNN, 20PNN
* **Data Series:**
* 2PNN (represented by white bars)
* Average-CNs for 2PNN (represented by a dark gray line)
* 10PNN (represented by gray bars)
* Average-CNs for 10PNN (represented by a black line)
* 20PNN (represented by dark gray bars)
* Average-CNs for 20PNN (represented by a light gray line)
* **Legend:** Located at the bottom-center of the chart, clearly associating colors and patterns with each model and its corresponding average CN line.
### Detailed Analysis
The chart is divided into three sections, one for each model (2PNN, 10PNN, 20PNN). Each section contains a bar graph representing the accuracy at epochs 100, 200, and 300, and a line graph representing the average accuracy of CNs over those epochs.
**2PNN:**
* At Epoch 100: Accuracy ≈ 98.1%
* At Epoch 200: Accuracy ≈ 98.15%
* At Epoch 300: Accuracy ≈ 98.15%
* Average-CNs Line: Starts at approximately 98.1% at Epoch 100, increases slightly to approximately 98.2% at Epoch 200, and remains relatively stable at approximately 98.2% at Epoch 300.
**10PNN:**
* At Epoch 100: Accuracy ≈ 97.7%
* At Epoch 200: Accuracy ≈ 98.0%
* At Epoch 300: Accuracy ≈ 98.0%
* Average-CNs Line: Starts at approximately 97.8% at Epoch 100, increases to approximately 98.1% at Epoch 200, and continues to approximately 98.15% at Epoch 300.
**20PNN:**
* At Epoch 100: Accuracy ≈ 97.8%
* At Epoch 200: Accuracy ≈ 97.85%
* At Epoch 300: Accuracy ≈ 97.9%
* Average-CNs Line: Starts at approximately 97.7% at Epoch 100, increases to approximately 97.9% at Epoch 200, and continues to approximately 97.95% at Epoch 300.
### Key Observations
* The 2PNN model consistently exhibits the highest accuracy across all epochs, with minimal improvement from Epoch 100 to Epoch 300.
* The 10PNN model shows a noticeable increase in accuracy from Epoch 100 to Epoch 200, but plateaus afterward.
* The 20PNN model demonstrates the lowest accuracy among the three, with a gradual increase over the 300 epochs.
* The Average-CNs lines generally follow the trend of the corresponding bar graphs, indicating a correlation between the model's accuracy and the average accuracy of CNs.
* The difference between the bar graph and the line graph for each model is relatively small, suggesting that the average accuracy of CNs is a good indicator of the model's performance.
### Interpretation
The data suggests that the 2PNN model performs best in terms of accuracy, achieving a high level of performance early on and maintaining it throughout the training process. The 10PNN model shows improvement with more epochs, but eventually reaches a plateau. The 20PNN model consistently underperforms compared to the other two, indicating that it may require further optimization or a different architecture.
The consistent trend between the bar graphs (model accuracy) and the lines (average CN accuracy) suggests that the CNs are a reliable metric for evaluating the performance of these models. The slight differences between the two could be attributed to the specific training data or hyperparameters used for each model.
The plateauing of accuracy for both the 2PNN and 10PNN models after a certain number of epochs suggests that further training may not yield significant improvements. This could indicate that the models have converged or that the training data is not sufficient to drive further learning.