## Bar and Line Chart: Accuracy vs. Epochs for Different PNN Configurations
### Overview
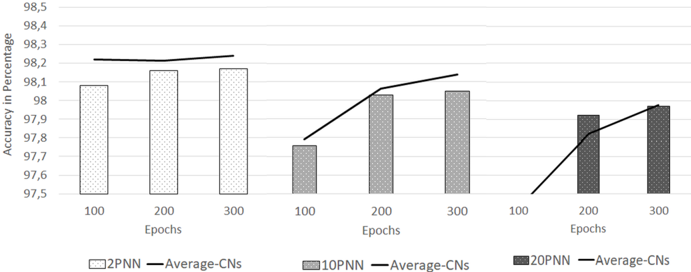
The image displays a combined bar and line chart comparing the accuracy (in percentage) of three different Probabilistic Neural Network (PNN) configurations across three training epoch milestones (100, 200, 300). Each configuration is represented by a cluster of bars (for accuracy) and an overlaid line (for "Average-CNs"). The chart is divided into three distinct sections, one for each PNN type.
### Components/Axes
* **Y-Axis (Vertical):** Labeled "Accuracy in Percentage". The scale runs from 97.5 to 98.5, with major gridlines at every 0.1% increment (97.5, 97.6, 97.7, 97.8, 97.9, 98.0, 98.1, 98.2, 98.3, 98.4, 98.5).
* **X-Axis (Horizontal):** Labeled "Epochs". It is segmented into three groups, each containing the categorical labels "100", "200", and "300".
* **Legend (Bottom Center):** Defines the visual encoding:
* **Bars:**
* `2PNN`: Light gray bar with a fine dotted pattern.
* `10PNN`: Medium gray bar with a denser dotted pattern.
* `20PNN`: Dark gray bar with the densest dotted pattern.
* **Lines:**
* `Average-CNs`: A solid black line. This label is repeated three times in the legend, once for each PNN group, indicating each line corresponds to the "Average-CNs" for that specific PNN configuration.
### Detailed Analysis
The chart is analyzed by isolating each of the three PNN configuration groups from left to right.
**Group 1: 2PNN (Leftmost Cluster)**
* **Bars (Accuracy):**
* Epoch 100: Bar height is approximately **98.08%**.
* Epoch 200: Bar height is approximately **98.16%**.
* Epoch 300: Bar height is approximately **98.17%**.
* **Line (Average-CNs):** The black line starts above the 100-epoch bar at a value of approximately **98.22%**, dips slightly at epoch 200 to ~**98.21%**, and rises to its highest point at epoch 300, approximately **98.24%**.
* **Trend:** Accuracy shows a slight, steady increase from epoch 100 to 300. The Average-CNs line is relatively flat, showing minimal variation.
**Group 2: 10PNN (Middle Cluster)**
* **Bars (Accuracy):**
* Epoch 100: Bar height is approximately **97.76%**.
* Epoch 200: Bar height is approximately **98.05%**.
* Epoch 300: Bar height is approximately **98.06%**.
* **Line (Average-CNs):** The black line starts at the 100-epoch bar at ~**97.76%**, rises sharply to ~**98.05%** at epoch 200, and continues to rise to ~**98.11%** at epoch 300.
* **Trend:** Accuracy shows a significant jump between epochs 100 and 200, then plateaus. The Average-CNs line shows a strong, consistent upward trend.
**Group 3: 20PNN (Rightmost Cluster)**
* **Bars (Accuracy):**
* Epoch 100: Bar height is approximately **97.50%** (appears to be at the baseline of the chart).
* Epoch 200: Bar height is approximately **97.91%**.
* Epoch 300: Bar height is approximately **97.96%**.
* **Line (Average-CNs):** The black line starts at the 100-epoch bar at ~**97.50%**, rises to ~**97.84%** at epoch 200, and continues to ~**97.97%** at epoch 300.
* **Trend:** Accuracy starts the lowest but shows the most dramatic relative improvement, especially between epochs 100 and 200. The Average-CNs line also shows a strong, continuous upward slope.
### Key Observations
1. **Inverse Initial Performance:** At epoch 100, the simplest model (2PNN) has the highest accuracy (~98.08%), while the most complex model (20PNN) has the lowest (~97.50%).
2. **Convergence with Training:** By epoch 300, the accuracy gap between the models narrows significantly. The 20PNN model (~97.96%) nearly catches up to the 10PNN model (~98.06%), though both remain below the 2PNN model (~98.17%).
3. **Learning Rate:** The 20PNN model exhibits the steepest learning curve, showing the largest percentage point gain from epoch 100 to 300 (~0.46%).
4. **Average-CNs Correlation:** For the 10PNN and 20PNN models, the "Average-CNs" line closely tracks and often slightly exceeds the accuracy bar height at each epoch, suggesting a strong positive correlation between this metric and accuracy as training progresses. For the 2PNN model, the Average-CNs line is consistently higher than the accuracy bars.
### Interpretation
This chart likely illustrates a trade-off in neural network design between initial performance, learning capacity, and final performance. The **2PNN** (presumably a simpler model with fewer parameters) learns quickly and achieves high accuracy early, but its performance plateaus, showing limited benefit from extended training (epochs 200-300). The **20PNN** (a more complex model) starts poorly, possibly due to underfitting or the need for more data/iterations to optimize its larger parameter space. However, it demonstrates a greater capacity to learn from additional training epochs, as shown by its steep improvement curve.
The "Average-CNs" metric (the exact meaning of "CNs" is not defined in the chart but could stand for "Correct Neighbors," "Confidence Network score," or a similar performance indicator) appears to be a leading or complementary indicator of model performance. Its strong upward trend for the more complex models suggests that as these models train, they not only improve in raw accuracy but also in this secondary metric, which may relate to model confidence or internal consistency. The fact that the 2PNN's Average-CNs is higher than its accuracy could indicate it is more "confident" in its predictions, even if slightly less accurate. The overall takeaway is that model complexity requires more training epochs to realize its potential benefits.