## Bar Chart: Model Accuracy Across Training Epochs
### Overview
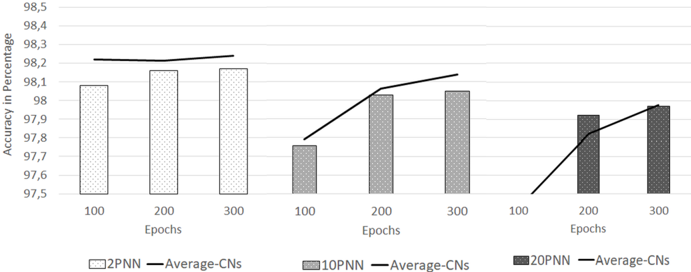
The chart compares the accuracy (in percentage) of three neural network models (2PNN, 10PNN, 20PNN) across training epochs (100, 200, 300). A black line labeled "Average-CNs" overlays the chart, showing a trend across epochs. The y-axis ranges from 97.5% to 98.5%, with bars grouped by epoch and model.
### Components/Axes
- **X-Axis**: Labeled "Epochs," divided into three segments: 100, 200, 300.
- **Y-Axis**: Labeled "Accuracy in Percentage," scaled from 97.5% to 98.5% in 0.1% increments.
- **Legend**: Located at the bottom, with four entries:
- **2PNN**: Light gray bars (hatched).
- **10PNN**: Medium gray bars (hatched).
- **20PNN**: Dark gray bars (hatched).
- **Average-CNs**: Black line (solid).
### Detailed Analysis
#### 2PNN Model
- **100 Epochs**: ~98.1% (light gray bar).
- **200 Epochs**: ~98.2% (light gray bar).
- **300 Epochs**: ~98.2% (light gray bar).
- **Trend**: Stable high accuracy across all epochs.
#### 10PNN Model
- **100 Epochs**: ~97.8% (medium gray bar).
- **200 Epochs**: ~98.1% (medium gray bar).
- **300 Epochs**: ~98.1% (medium gray bar).
- **Trend**: Slight improvement from 100 to 200 epochs, then plateaus.
#### 20PNN Model
- **100 Epochs**: ~97.8% (dark gray bar).
- **200 Epochs**: ~97.9% (dark gray bar).
- **300 Epochs**: ~98.0% (dark gray bar).
- **Trend**: Gradual improvement over epochs.
#### Average-CNs Line
- **100 Epochs**: ~98.2% (black line).
- **200 Epochs**: ~98.0% (black line).
- **300 Epochs**: ~98.1% (black line).
- **Trend**: Slight decrease from 100 to 200 epochs, followed by a minor increase.
### Key Observations
1. **2PNN Dominance**: Consistently achieves the highest accuracy (~98.1–98.2%) across all epochs.
2. **Model Scaling**: 10PNN and 20PNN show lower accuracy than 2PNN but improve with more epochs.
3. **Average-CNs Fluctuation**: The black line suggests a baseline trend, dipping slightly at 200 epochs before recovering.
4. **Hatching Consistency**: All bars use diagonal hatching, with darker shades for higher epoch counts (20PNN > 10PNN > 2PNN).
### Interpretation
The chart demonstrates that the 2PNN model outperforms 10PNN and 20PNN in accuracy, even with fewer epochs. While 10PNN and 20PNN show marginal gains with increased training, their performance remains below 2PNN. The "Average-CNs" line likely represents an aggregated or reference performance, indicating that models generally maintain high accuracy but with variability. The 20PNN model’s gradual improvement suggests that deeper networks (more parameters) may benefit from extended training, though they still lag behind simpler architectures like 2PNN. This could imply a trade-off between model complexity and training efficiency.