## Heatmaps: Digit Distribution Before and After GRPO Processing
### Overview
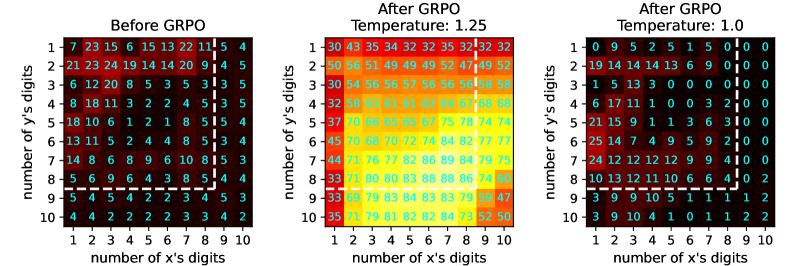
The image contains three side-by-side heatmaps comparing digit distribution patterns before and after GRPO processing at different temperatures. Each heatmap uses a 10x10 grid where rows represent "number of y's digits" (1-10) and columns represent "number of x's digits" (1-10). Color intensity indicates magnitude, with red/yellow representing higher values and blue representing lower values.
### Components/Axes
- **X-axis**: "number of x's digits" (1-10)
- **Y-axis**: "number of y's digits" (1-10)
- **Heatmap Titles**:
1. "Before GRPO"
2. "After GRPO Temperature: 1.25"
3. "After GRPO Temperature: 1.0"
- **Color Gradient**: Red (high values) → Yellow (medium) → Blue (low values)
### Detailed Analysis
#### Before GRPO
- **Row 1 (y=1)**: 7, 23, 15, 6, 15, 13, 22, 11, 5, 4
- **Row 2 (y=2)**: 21, 23, 24, 19, 14, 14, 20, 9, 4, 5
- **Row 3 (y=3)**: 6, 12, 20, 8, 5, 3, 5, 3, 5, 5
- **Row 4 (y=4)**: 8, 18, 11, 3, 2, 2, 4, 5, 3, 5
- **Row 5 (y=5)**: 18, 10, 6, 1, 2, 1, 8, 5, 5, 4
- **Row 6 (y=6)**: 13, 11, 5, 2, 4, 4, 8, 5, 3, 4
- **Row 7 (y=7)**: 14, 8, 6, 8, 9, 6, 10, 8, 5, 3
- **Row 8 (y=8)**: 5, 6, 9, 6, 4, 3, 8, 5, 4, 4
- **Row 9 (y=9)**: 5, 4, 5, 4, 2, 3, 4, 5, 3, 2
- **Row 10 (y=10)**: 4, 4, 2, 2, 2, 3, 3, 4, 2, 2
#### After GRPO (T=1.25)
- **Row 1 (y=1)**: 30, 43, 35, 34, 32, 32, 35, 32, 32, 32
- **Row 2 (y=2)**: 50, 56, 51, 49, 49, 49, 52, 47, 49, 52
- **Row 3 (y=3)**: 30, 54, 56, 56, 57, 56, 56, 58, 58, 58
- **Row 4 (y=4)**: 32, 58, 63, 61, 61, 62, 64, 67, 68, 68
- **Row 5 (y=5)**: 37, 70, 66, 65, 65, 67, 75, 78, 74, 74
- **Row 6 (y=6)**: 45, 70, 68, 70, 72, 74, 84, 82, 77, 77
- **Row 7 (y=7)**: 44, 71, 76, 77, 82, 86, 89, 94, 79, 75
- **Row 8 (y=8)**: 33, 71, 80, 80, 83, 88, 88, 86, 74, 60
- **Row 9 (y=9)**: 33, 69, 79, 83, 84, 83, 83, 79, 59, 47
- **Row 10 (y=10)**: 35, 71, 79, 81, 82, 82, 84, 73, 52, 50
#### After GRPO (T=1.0)
- **Row 1 (y=1)**: 0, 9, 5, 2, 5, 1, 5, 0, 0, 0
- **Row 2 (y=2)**: 19, 14, 14, 13, 6, 9, 0, 0, 0, 0
- **Row 3 (y=3)**: 1, 5, 13, 3, 0, 0, 0, 0, 0, 0
- **Row 4 (y=4)**: 6, 17, 11, 1, 0, 0, 3, 2, 0, 0
- **Row 5 (y=5)**: 21, 15, 9, 1, 1, 3, 6, 3, 0, 0
- **Row 6 (y=6)**: 25, 14, 7, 4, 9, 5, 9, 2, 0, 0
- **Row 7 (y=7)**: 24, 12, 12, 12, 9, 9, 4, 0, 0, 0
- **Row 8 (y=8)**: 10, 13, 12, 11, 10, 6, 6, 4, 0, 2
- **Row 9 (y=9)**: 3, 9, 10, 4, 1, 1, 1, 1, 2, 2
- **Row 10 (y=10)**: 3, 9, 10, 4, 1, 0, 1, 1, 2, 2
### Key Observations
1. **Before GRPO**: Values range from 1-24, with moderate clustering in mid-range values (8-15).
2. **After GRPO (T=1.25)**: Values increase significantly (up to 94), showing a gradient from red (high values) to blue (low values), with peak intensity in middle rows (y=5-7).
3. **After GRPO (T=1.0)**: Values drop dramatically, with 60% of cells containing 0-10. The bottom-right quadrant shows near-zero values, indicating strong suppression of higher digit combinations.
### Interpretation
The GRPO processing appears to:
1. **Amplify mid-range values** at higher temperatures (T=1.25), suggesting optimization of specific digit combinations.
2. **Suppress extreme values** at lower temperatures (T=1.0), particularly eliminating higher digit combinations (x=7-10, y=8-10).
3. **Introduce systematic zeros** in the T=1.0 heatmap, indicating threshold-based filtering or elimination of certain patterns.
The temperature parameter acts as a control knob: higher temperatures preserve more complex patterns while lower temperatures enforce stricter simplification. The near-total elimination of values >10 at T=1.0 suggests a phase transition in the system's behavior.