## Charts: Performance Comparison of Language Models
### Overview
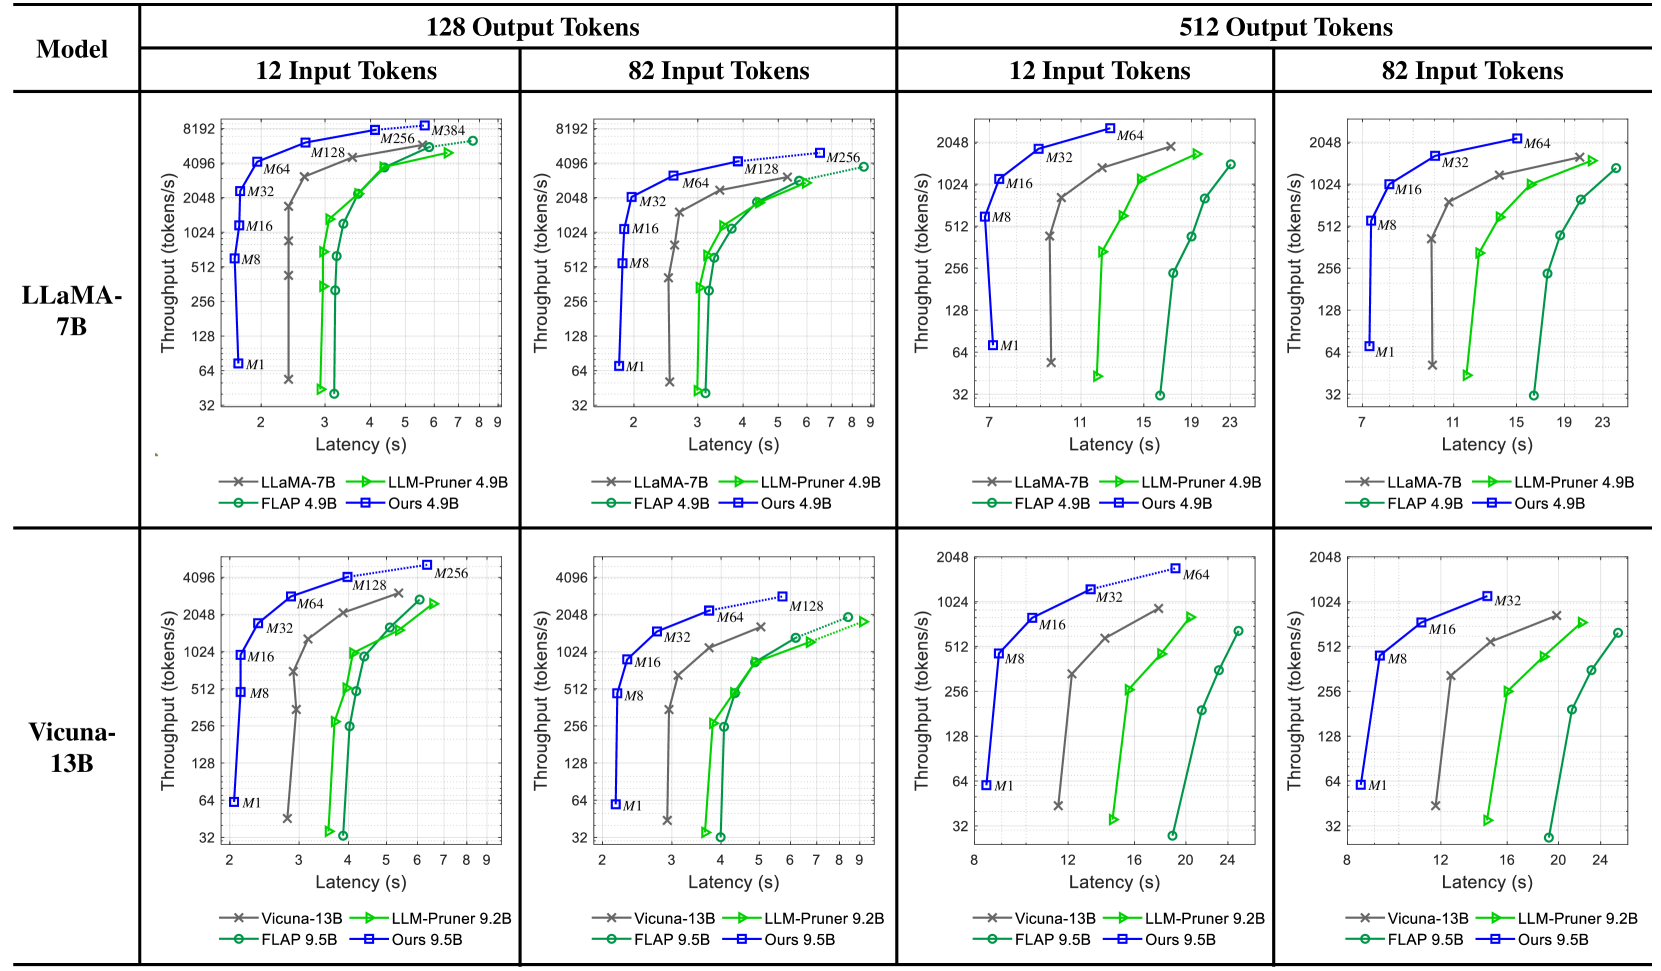
The image presents a series of four charts, arranged in a 2x2 grid, comparing the performance of different language models (LLaMA-7B and Vicuna-13B) under varying conditions. Each chart visualizes the relationship between latency (in seconds) and throughput (in tokens/second). The models being compared are LLaMA-7B, LLM-Pruner 4.9B, FLAP 4.9B, and "Ours" 4.9B. The charts are categorized by input and output token lengths: 12 Input Tokens, 82 Input Tokens, 12 Input Tokens, and 82 Input Tokens. Each chart contains data points for each model, plotted as lines with distinct colors.
### Components/Axes
* **X-axis:** Latency (seconds). Scales vary per chart, ranging from 0-9s and 0-23s.
* **Y-axis:** Throughput (tokens/second). Scales are consistent across all charts, ranging from 32 to 8192.
* **Models (Lines/Markers):**
* LLaMA-7B (Red, 'x' marker)
* LLM-Pruner 4.9B (Blue, '+' marker)
* FLAP 4.9B (Green, 'o' marker)
* Ours 4.9B (Purple, '*' marker)
* **Titles:** Each chart is titled with the input/output token configuration (e.g., "12 Input Tokens", "82 Input Tokens").
* **Legend:** Located at the bottom of each chart, identifying each line/marker with its corresponding model name and parameter size.
* **Model Labels:** "LLaMA-7B", "Vicuna-13B" are placed at the top-left of their respective 2x2 grid sections.
* **Token Labels:** "12 Input Tokens", "82 Input Tokens", "12 Input Tokens", "82 Input Tokens" are placed at the top of each chart.
### Detailed Analysis or Content Details
**Chart 1: LLaMA-7B, 12 Input Tokens, 128 Output Tokens**
* **LLaMA-7B (Red):** Starts at approximately 32 tokens/s at 2s latency, rises to approximately 4096 tokens/s at 6s latency.
* **LLM-Pruner 4.9B (Blue):** Starts at approximately 64 tokens/s at 2s latency, rises to approximately 2048 tokens/s at 6s latency.
* **FLAP 4.9B (Green):** Starts at approximately 128 tokens/s at 2s latency, rises to approximately 1024 tokens/s at 6s latency.
* **Ours 4.9B (Purple):** Starts at approximately 256 tokens/s at 2s latency, rises to approximately 4096 tokens/s at 6s latency.
**Chart 2: LLaMA-7B, 82 Input Tokens, 128 Output Tokens**
* **LLaMA-7B (Red):** Starts at approximately 32 tokens/s at 2s latency, rises to approximately 4096 tokens/s at 7s latency.
* **LLM-Pruner 4.9B (Blue):** Starts at approximately 64 tokens/s at 2s latency, rises to approximately 2048 tokens/s at 7s latency.
* **FLAP 4.9B (Green):** Starts at approximately 128 tokens/s at 2s latency, rises to approximately 1024 tokens/s at 7s latency.
* **Ours 4.9B (Purple):** Starts at approximately 256 tokens/s at 2s latency, rises to approximately 4096 tokens/s at 7s latency.
**Chart 3: Vicuna-13B, 12 Input Tokens, 512 Output Tokens**
* **LLaMA-7B (Red):** Starts at approximately 32 tokens/s at 7s latency, rises to approximately 2048 tokens/s at 19s latency.
* **LLM-Pruner 4.9B (Blue):** Starts at approximately 64 tokens/s at 7s latency, rises to approximately 1024 tokens/s at 19s latency.
* **FLAP 4.9B (Green):** Starts at approximately 128 tokens/s at 7s latency, rises to approximately 512 tokens/s at 19s latency.
* **Ours 4.9B (Purple):** Starts at approximately 256 tokens/s at 7s latency, rises to approximately 2048 tokens/s at 19s latency.
**Chart 4: Vicuna-13B, 82 Input Tokens, 512 Output Tokens**
* **LLaMA-7B (Red):** Starts at approximately 32 tokens/s at 11s latency, rises to approximately 2048 tokens/s at 23s latency.
* **LLM-Pruner 4.9B (Blue):** Starts at approximately 64 tokens/s at 11s latency, rises to approximately 1024 tokens/s at 23s latency.
* **FLAP 4.9B (Green):** Starts at approximately 128 tokens/s at 11s latency, rises to approximately 512 tokens/s at 23s latency.
* **Ours 4.9B (Purple):** Starts at approximately 256 tokens/s at 11s latency, rises to approximately 2048 tokens/s at 23s latency.
### Key Observations
* "Ours" 4.9B consistently achieves the highest throughput across all charts, often reaching the maximum throughput value of 4096 or 2048 tokens/s.
* LLaMA-7B generally exhibits the lowest throughput, especially at lower latency values.
* Increasing the input token length (from 12 to 82) generally increases the latency required to achieve a given throughput.
* The performance gap between the models tends to widen at higher throughput levels.
* FLAP 4.9B consistently performs better than LLaMA-7B but is generally outperformed by LLM-Pruner 4.9B and "Ours" 4.9B.
### Interpretation
The data demonstrates a clear performance advantage for the "Ours" 4.9B model across all tested conditions. This model consistently delivers higher throughput for a given latency compared to the other models. The results suggest that the "Ours" model is more efficient at processing both shorter and longer input sequences. The trade-off between latency and throughput is evident in all charts; achieving higher throughput generally requires accepting higher latency. The performance differences between the models are likely due to variations in model architecture, training data, and optimization techniques. The consistent underperformance of LLaMA-7B may indicate that its architecture is less suited for the tested tasks or that it requires further optimization. The increase in latency with longer input sequences is expected, as processing longer sequences requires more computational resources. The charts provide valuable insights into the performance characteristics of different language models, which can inform model selection and optimization efforts. The consistent outperformance of "Ours" suggests it is a strong candidate for applications requiring high throughput and reasonable latency.