## Line Chart: Step Length vs Reasoning Tokens for Four Shot Hard Blocksworld
### Overview
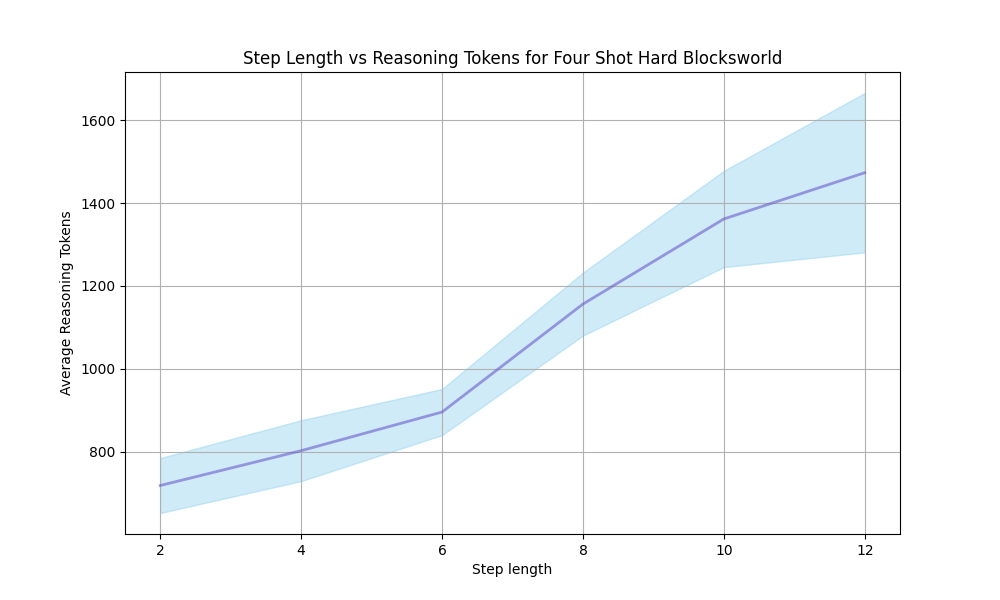
This chart depicts the relationship between step length and the average number of reasoning tokens used, specifically for the "Four Shot Hard Blocksworld" problem. The chart uses a line graph with a shaded confidence interval to illustrate the trend.
### Components/Axes
* **Title:** "Step Length vs Reasoning Tokens for Four Shot Hard Blocksworld" - positioned at the top-center of the chart.
* **X-axis:** "Step length" - ranging from approximately 2 to 12, with tick marks at integer values.
* **Y-axis:** "Average Reasoning Tokens" - ranging from approximately 600 to 1600, with tick marks at intervals of 200.
* **Data Series:** A single blue line representing the average reasoning tokens, with a light blue shaded area indicating a confidence interval.
### Detailed Analysis
The blue line representing the average reasoning tokens exhibits a clear upward trend as step length increases. The confidence interval widens as step length increases, indicating greater uncertainty in the average reasoning token count at larger step lengths.
Here's an approximate extraction of data points, acknowledging the inherent uncertainty in reading values from the graph:
* **Step Length = 2:** Average Reasoning Tokens ≈ 750
* **Step Length = 4:** Average Reasoning Tokens ≈ 850
* **Step Length = 6:** Average Reasoning Tokens ≈ 950
* **Step Length = 8:** Average Reasoning Tokens ≈ 1200
* **Step Length = 10:** Average Reasoning Tokens ≈ 1450
* **Step Length = 12:** Average Reasoning Tokens ≈ 1600
The shaded confidence interval appears to be approximately ±100-200 tokens around the blue line, but this varies with step length. At step length 2, the interval is narrower, while at step length 12, it is wider.
### Key Observations
* There is a strong positive correlation between step length and the average number of reasoning tokens.
* The uncertainty in the average reasoning token count increases with step length.
* The data suggests that longer step lengths require more reasoning tokens.
### Interpretation
The chart demonstrates that as the complexity of the problem-solving process (represented by step length) increases, the amount of reasoning required (measured in tokens) also increases. This is expected, as more steps generally necessitate more computational effort. The widening confidence interval at higher step lengths suggests that the relationship between step length and reasoning tokens may become more variable or less predictable as the problem becomes more complex. This could be due to factors such as increased branching in the search space or the emergence of more diverse solution strategies. The "Four Shot Hard Blocksworld" context implies this is a challenging problem, and the data reflects the increased cognitive load associated with solving it. The data suggests that there is a cost to increasing step length in terms of reasoning tokens, which could be relevant for optimizing the efficiency of problem-solving algorithms.