## Scatter Plot: Philosophy
### Overview
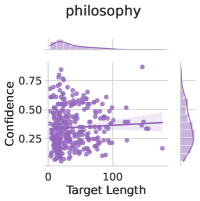
The image is a scatter plot titled "philosophy". It displays the relationship between "Target Length" on the x-axis and "Confidence" on the y-axis. The plot includes a regression line with a confidence interval. Marginal distributions are shown along the top and right edges of the plot.
### Components/Axes
* **Title:** philosophy
* **X-axis:** Target Length
* Scale: 0 to 100, with tick marks at 0 and 100.
* **Y-axis:** Confidence
* Scale: 0 to 0.75, with tick marks at 0, 0.25, 0.50, and 0.75.
* **Data Points:** Each point represents a data entry, colored in purple.
* **Regression Line:** A purple line shows the linear regression fit to the data.
* **Confidence Interval:** A shaded purple area around the regression line represents the confidence interval.
* **Marginal Distributions:**
* Top: A density plot showing the distribution of "Target Length".
* Right: A density plot showing the distribution of "Confidence".
### Detailed Analysis
* **Data Point Distribution:** The data points are concentrated towards the lower left of the plot, indicating that most data entries have shorter target lengths and lower confidence scores.
* **Regression Line Trend:** The regression line is nearly flat, suggesting a very weak or non-existent positive correlation between "Target Length" and "Confidence".
* **Confidence Interval:** The confidence interval is relatively wide, indicating a high degree of uncertainty in the regression line.
* **Marginal Distributions:**
* "Target Length": The distribution is heavily skewed to the right, indicating that most target lengths are short.
* "Confidence": The distribution is somewhat bimodal, with peaks around 0.25 and 0.5.
### Key Observations
* There is a high concentration of data points with short target lengths and low confidence.
* The regression line suggests a very weak positive correlation between target length and confidence.
* The wide confidence interval indicates a high degree of uncertainty in the regression line.
### Interpretation
The scatter plot suggests that, for the "philosophy" category, there is little to no correlation between the length of the target and the confidence score. The concentration of points at low target lengths and low confidence suggests that shorter targets tend to have lower confidence scores, but the weak regression line indicates that this relationship is not strong. The wide confidence interval further emphasizes the uncertainty in this relationship. The marginal distributions show that most targets are short and that confidence scores tend to cluster around 0.25 and 0.5.