## Scatter Plot: Confidence vs. Target Length in Philosophy
### Overview
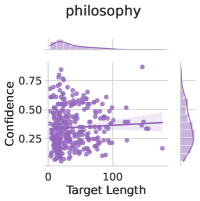
The image is a scatter plot titled "philosophy," visualizing the relationship between "Target Length" (x-axis) and "Confidence" (y-axis). Purple data points are distributed across the plot, with a dashed trend line and shaded confidence interval. Marginal histograms on the top and right edges show distributions of the variables.
### Components/Axes
- **Title**: "philosophy" (centered at the top).
- **X-axis**:
- Label: "Target Length"
- Scale: 0 to 100 (linear increments).
- **Y-axis**:
- Label: "Confidence"
- Scale: 0.25 to 0.75 (linear increments).
- **Legend**: Not explicitly labeled, but the purple data points and dashed line are visually distinct.
- **Marginal Plots**:
- Top histogram: Distribution of "Target Length" (x-axis data).
- Right histogram: Distribution of "Confidence" (y-axis data).
### Detailed Analysis
- **Data Points**:
- Approximately 50-100 purple dots scattered across the plot.
- Most points cluster between **Target Length = 0–50** and **Confidence = 0.3–0.6**.
- Outliers: A few points extend to **Target Length > 80** and **Confidence < 0.25**.
- **Trend Line**:
- Dashed line slopes **slightly downward** from left to right, indicating a weak negative correlation.
- Equation not provided, but the slope suggests a marginal decrease in confidence with increasing target length.
- **Confidence Interval**:
- Shaded region around the trend line (light purple) spans **±0.15** from the line, indicating variability in the relationship.
- **Histograms**:
- Top histogram: Bimodal distribution with peaks near **Target Length = 20** and **80**.
- Right histogram: Unimodal peak near **Confidence = 0.4–0.5**.
### Key Observations
1. **Negative Correlation**: The trend line suggests that longer target lengths may correlate with lower confidence, though the relationship is weak.
2. **Data Spread**: Most data points are concentrated in the lower-left quadrant, with sparse points in the upper-right.
3. **Histograms**: The bimodal distribution of target lengths implies two common ranges (short and long), while confidence values are more uniformly distributed.
### Interpretation
The plot suggests that in philosophical contexts, shorter target lengths may be associated with higher confidence, possibly due to simpler or more focused tasks. The weak negative trend could indicate that longer tasks (e.g., complex arguments or extended analyses) introduce uncertainty. The shaded confidence interval highlights the variability in this relationship, suggesting that individual cases may deviate significantly from the trend. The histograms reinforce this by showing that target lengths are more varied than confidence scores, which cluster around mid-range values. This could reflect a dataset where confidence is relatively stable despite differences in task complexity.