## Line Chart: Completeness vs. Samples
### Overview
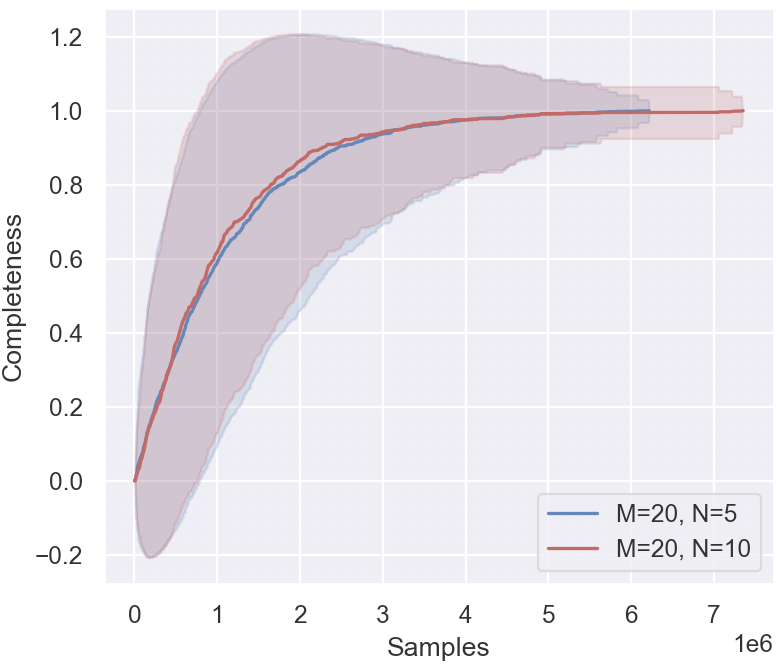
The image is a line chart comparing the completeness of two data series against the number of samples. Both series represent data with M=20, but one has N=5 and the other has N=10. The chart displays how completeness increases with the number of samples for each series, including shaded regions indicating variability.
### Components/Axes
* **X-axis:** "Samples" with values ranging from 0 to 7e6 (7 million).
* **Y-axis:** "Completeness" with values ranging from -0.2 to 1.2.
* **Legend (bottom-right):**
* Blue line: "M=20, N=5"
* Red line: "M=20, N=10"
### Detailed Analysis
* **Blue Line (M=20, N=5):**
* Trend: Initially increases rapidly, then plateaus around 1.0.
* Data Points:
* Starts at approximately 0 at 0 samples.
* Reaches approximately 0.8 at 1e6 samples.
* Reaches approximately 0.9 at 2e6 samples.
* Plateaus around 1.0 after 5e6 samples.
* Shaded region: Light blue, indicating variability around the blue line.
* **Red Line (M=20, N=10):**
* Trend: Initially increases rapidly, then plateaus around 1.0.
* Data Points:
* Starts at approximately 0 at 0 samples.
* Reaches approximately 0.7 at 1e6 samples.
* Reaches approximately 0.95 at 2e6 samples.
* Plateaus around 1.0 after 5e6 samples.
* Shaded region: Light red, indicating variability around the red line.
### Key Observations
* Both lines show a similar trend: rapid initial increase in completeness followed by a plateau.
* The red line (M=20, N=10) initially lags behind the blue line (M=20, N=5) but eventually converges to a similar completeness level.
* The shaded regions indicate variability in the completeness for both series, with the variability appearing to decrease as the number of samples increases.
### Interpretation
The chart suggests that increasing the number of samples leads to higher completeness in both data series. The series with N=5 initially achieves higher completeness with fewer samples, but the series with N=10 eventually catches up. This could indicate that a larger N value requires more samples to reach optimal completeness, but ultimately achieves a similar level of completeness as a smaller N value. The shaded regions highlight the inherent variability in the completeness measure, which is likely due to the stochastic nature of the sampling process. The convergence of both lines to a completeness of approximately 1.0 suggests that there is a limit to how much completeness can be achieved, regardless of the number of samples or the value of N.