## Line Graph: Completeness vs. Samples (M=20, N=5 vs. N=10)
### Overview
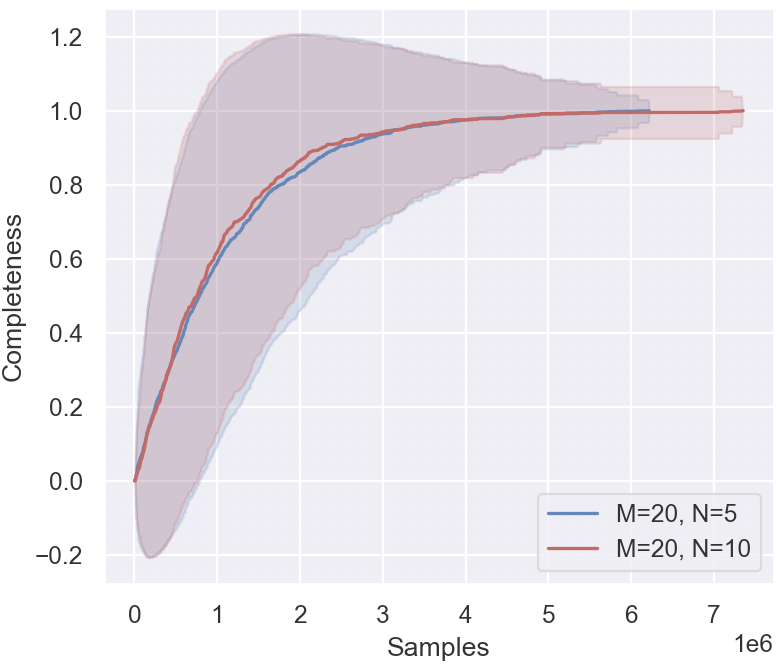
The image depicts a line graph comparing the relationship between "Completeness" and "Samples" for two datasets: one with N=5 (blue line) and another with N=10 (red line), both at M=20. The graph shows how completeness increases with the number of samples, with shaded regions indicating variability or confidence intervals. The x-axis spans from 0 to 7 million samples, while the y-axis ranges from -0.2 to 1.2.
### Components/Axes
- **X-axis (Samples)**: Labeled "Samples," scaled logarithmically from 0 to 7 million (1e6).
- **Y-axis (Completeness)**: Labeled "Completeness," ranging from -0.2 to 1.2.
- **Legend**: Located in the bottom-right corner, with two entries:
- **Blue line**: M=20, N=5
- **Red line**: M=20, N=10
- **Shaded Regions**: Gray areas surrounding each line, representing variability or uncertainty.
### Detailed Analysis
1. **Blue Line (M=20, N=5)**:
- Starts at (0, 0) and rises sharply, reaching ~0.95 completeness at ~3 million samples.
- Completeness plateaus near 1.0 after ~5 million samples.
- Shaded region widest at ~1 million samples, narrowing as samples increase.
2. **Red Line (M=20, N=10)**:
- Starts at (0, 0) and rises slightly faster than the blue line, reaching ~0.98 completeness at ~3 million samples.
- Completeness plateaus near 1.0 after ~5 million samples.
- Shaded region narrower than the blue line across all sample counts.
3. **Key Data Points**:
- At 1 million samples:
- Blue: ~0.6 completeness
- Red: ~0.7 completeness
- At 3 million samples:
- Blue: ~0.95 completeness
- Red: ~0.98 completeness
- At 7 million samples:
- Both lines approach ~1.0 completeness.
### Key Observations
- The red line (N=10) consistently outperforms the blue line (N=5) in completeness across all sample counts.
- Completeness improves rapidly with increasing samples, with diminishing returns after ~5 million samples.
- The shaded regions indicate higher variability for N=5, especially at lower sample counts.
### Interpretation
The data suggests that increasing N (from 5 to 10) improves completeness, particularly at lower sample counts. For example, at 1 million samples, N=10 achieves ~0.7 completeness vs. ~0.6 for N=5. However, both configurations converge to near-perfect completeness (~1.0) as samples exceed 5 million. The narrower shaded region for N=10 implies more stable or reliable measurements under this configuration. This trend highlights the trade-off between sample quantity and parameter tuning (N) in achieving high completeness.