## Violin Plot and Bar Chart: Human Operation Time and Accuracy Comparison
### Overview
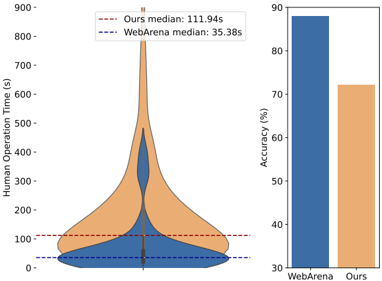
The image contains two side-by-side visualizations comparing two systems: "WebArena" and "Ours." The left side features a violin plot showing the distribution of human operation times (in seconds), while the right side displays a bar chart comparing accuracy percentages. Key metrics include medians for operation time and accuracy percentages for each system.
---
### Components/Axes
#### Left Violin Plot
- **Y-Axis**: "Human Operation Time (s)" with a scale from 0 to 900.
- **X-Axis**: Unlabeled, with two categories: "WebArena" (blue) and "Ours" (orange).
- **Legend**:
- Dashed red line: "Ours median: 111.94s"
- Dashed blue line: "WebArena median: 35.38s"
- **Distribution**:
- "Ours" (orange): Wide distribution with a peak near 100s, extending to ~900s.
- "WebArena" (blue): Narrow distribution, concentrated between 0–200s.
#### Right Bar Chart
- **Y-Axis**: "Accuracy (%)" with a scale from 30% to 90%.
- **X-Axis**: Two categories: "WebArena" (blue) and "Ours" (orange).
- **Values**:
- "WebArena": ~85% accuracy.
- "Ours": ~65% accuracy.
---
### Detailed Analysis
#### Violin Plot Trends
- **Ours**:
- Median at 111.94s (dashed red line).
- Distribution spans 0–900s, with a sharp peak near 100s and a long tail extending to 900s.
- Indicates high variability in human operation times.
- **WebArena**:
- Median at 35.38s (dashed blue line).
- Distribution tightly clustered between 0–200s, with minimal spread.
- Suggests consistent, faster operation times.
#### Bar Chart Trends
- **Accuracy**:
- "WebArena" achieves ~85% accuracy (blue bar).
- "Ours" achieves ~65% accuracy (orange bar).
- "WebArena" outperforms "Ours" by ~20 percentage points.
---
### Key Observations
1. **Operation Time Disparity**:
- "Ours" has a median operation time **3x higher** than "WebArena" (111.94s vs. 35.38s).
- "Ours" exhibits extreme outliers (up to 900s), while "WebArena" remains tightly bounded.
2. **Accuracy Trade-off**:
- "WebArena" achieves significantly higher accuracy (~85%) compared to "Ours" (~65%).
- Suggests a potential inverse relationship between speed and accuracy.
---
### Interpretation
The data implies a trade-off between **speed** and **accuracy** between the two systems:
- **WebArena** prioritizes **efficiency**, with faster operation times and higher accuracy, likely optimized for streamlined tasks.
- **Ours** exhibits **higher variability** in operation times, possibly due to handling more complex or diverse tasks, but at the cost of lower accuracy.
- The stark difference in medians (111.94s vs. 35.38s) highlights a critical performance gap, while the accuracy disparity (~85% vs. ~65%) raises questions about the systems' intended use cases or design priorities.
This analysis underscores the need to balance operational efficiency with task-specific requirements when evaluating such systems.