## Neuron and Artificial Neural Network Comparison
### Overview
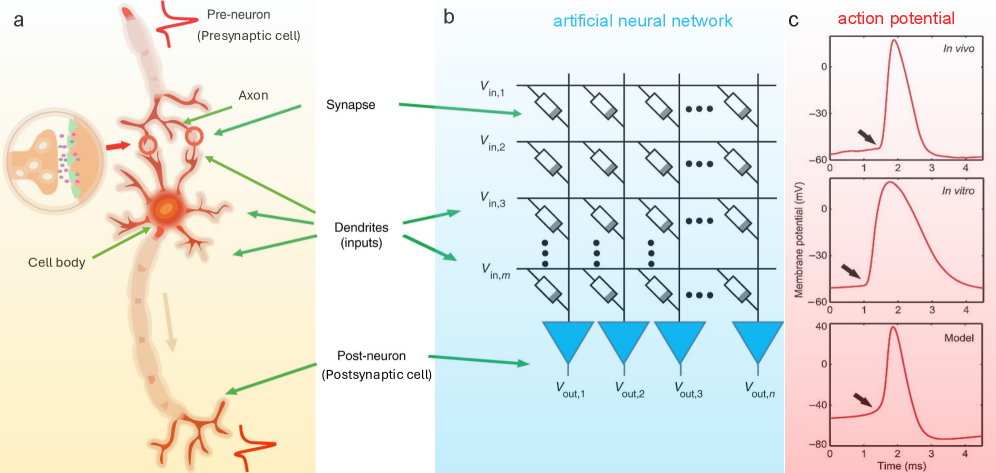
The image presents a comparison between a biological neuron and an artificial neural network, along with action potential graphs from in vivo, in vitro, and model simulations. The image is divided into three sections labeled a, b, and c. Section a illustrates a biological neuron, section b depicts an artificial neural network, and section c shows action potential graphs.
### Components/Axes
**Section a: Biological Neuron**
* **Labels:**
* Pre-neuron (Presynaptic cell)
* Axon
* Synapse
* Dendrites (inputs)
* Post-neuron (Postsynaptic cell)
* Cell body
**Section b: Artificial Neural Network**
* **Title:** artificial neural network
* **Inputs:** V<sub>in,1</sub>, V<sub>in,2</sub>, V<sub>in,3</sub>, V<sub>in,m</sub>
* **Outputs:** V<sub>out,1</sub>, V<sub>out,2</sub>, V<sub>out,3</sub>, V<sub>out,n</sub>
* The network consists of a grid of interconnected elements, with resistor-like symbols connecting the input and output nodes.
**Section c: Action Potential**
* **Title:** action potential
* **Y-axis:** Membrane potential (mV)
* Scale: -60 to 0 in the top two graphs, -80 to 40 in the bottom graph.
* **X-axis:** Time (ms)
* Scale: 0 to 4
* **Graphs:**
* In vivo
* In vitro
* Model
* Each graph shows a red line representing the action potential over time. A black arrow points to the approximate starting point of the action potential rise.
### Detailed Analysis or ### Content Details
**Section a: Biological Neuron**
* The neuron is depicted with its main components labeled. The pre-neuron connects to the axon, which leads to the synapse. The synapse connects to the dendrites of the post-neuron. The cell body is also labeled.
**Section b: Artificial Neural Network**
* The artificial neural network is represented as a grid. The inputs are labeled V<sub>in,1</sub>, V<sub>in,2</sub>, V<sub>in,3</sub>, and V<sub>in,m</sub>. The outputs are labeled V<sub>out,1</sub>, V<sub>out,2</sub>, V<sub>out,3</sub>, and V<sub>out,n</sub>. The connections between the inputs and outputs are represented by resistor-like symbols.
**Section c: Action Potential**
* **In vivo:** The red line starts at approximately -60 mV at 0 ms. It rises sharply to a peak around 10 mV at approximately 2 ms, then decreases back down.
* **In vitro:** The red line starts at approximately -60 mV at 0 ms. It rises sharply to a peak around 0 mV at approximately 2 ms, then decreases back down.
* **Model:** The red line starts at approximately -60 mV at 0 ms. It rises sharply to a peak around 40 mV at approximately 2 ms, then decreases back down.
### Key Observations
* The biological neuron diagram highlights the key components involved in neuronal communication.
* The artificial neural network diagram shows a simplified representation of interconnected nodes.
* The action potential graphs show the change in membrane potential over time for in vivo, in vitro, and model simulations.
* The action potential peaks vary between the three graphs, with the model showing the highest peak.
### Interpretation
The image illustrates the analogy between a biological neuron and an artificial neural network. Section a shows the structure of a biological neuron, highlighting the key components involved in signal transmission. Section b presents a simplified model of an artificial neural network, demonstrating how interconnected nodes can process information. Section c compares the action potential graphs from in vivo, in vitro, and model simulations. The differences in the action potential peaks suggest that the model may not perfectly replicate the biological system, but it captures the general trend of membrane potential change over time. The image suggests that artificial neural networks are inspired by the structure and function of biological neurons, but they are simplified representations of complex biological systems.