## Diagram: Biological Neuron and Artificial Neural Network with Action Potential Analysis
### Overview
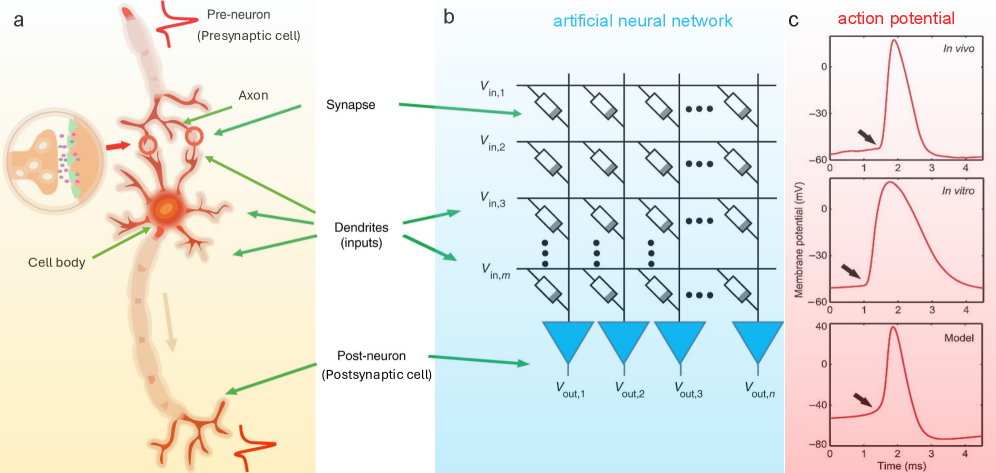
The image presents three interconnected sections:
1. **Biological Neuron (a)**: A detailed anatomical diagram of a neuron, highlighting presynaptic and postsynaptic cells, dendrites, axon, and cell body.
2. **Artificial Neural Network (b)**: A schematic representation of a multi-layered neural network with input, hidden, and output layers, showing voltage values (V_in, V_out).
3. **Action Potential Graphs (c)**: Three overlaid graphs comparing membrane potential over time in *in vivo*, *in vitro*, and *model* conditions.
---
### Components/Axes
#### a. Biological Neuron
- **Labels**:
- **Pre-neuron (Presynaptic cell)**: Red arrow pointing to the neuron's input region.
- **Axon**: Red arrow tracing the neuron's elongated structure.
- **Cell body**: Central orange structure with dendritic branches.
- **Dendrites (inputs)**: Green arrows indicating input reception.
- **Post-neuron (Postsynaptic cell)**: Green arrow pointing to the neuron's output region.
- **Spatial Grounding**:
- Dendrites are clustered around the cell body (center-left).
- Axon extends vertically from the cell body (top-right).
#### b. Artificial Neural Network
- **Structure**:
- **Input Layer**: 4 nodes (V_in,1 to V_in,4) with varying activation patterns (dots).
- **Hidden Layer**: 4 nodes (V_out,1 to V_out,4) with summation symbols (Σ).
- **Output Layer**: 4 nodes (V_out,1 to V_out,4) with triangular activation functions.
- **Axes**:
- **X-axis**: Layers (Input → Hidden → Output).
- **Y-axis**: Nodes (V_in,1 to V_out,4).
#### c. Action Potential Graphs
- **Axes**:
- **X-axis**: Time (ms), ranging from 0 to 4 ms.
- **Y-axis**: Membrane potential (mV), ranging from -80 to 40 mV.
- **Legends**:
- **Red**: *In vivo* (biological experiment).
- **Blue**: *In vitro* (isolated tissue).
- **Black**: *Model* (simulated data).
---
### Detailed Analysis
#### a. Biological Neuron
- **Flow**:
- Dendrites receive inputs (green arrows) → Cell body integrates signals → Axon transmits output (red arrow) → Postsynaptic cell responds.
- **Key Features**:
- Dendritic spines (small protrusions) are visible on the cell body.
- Axon terminals form synapses with the postsynaptic cell.
#### b. Artificial Neural Network
- **Voltage Values**:
- **Input Layer**:
- V_in,1: 3 dots (high activation).
- V_in,2: 2 dots.
- V_in,3: 1 dot.
- V_in,4: No activation.
- **Hidden Layer**:
- V_out,1: 3 dots.
- V_out,2: 2 dots.
- V_out,3: 1 dot.
- V_out,4: No activation.
- **Output Layer**:
- V_out,1 to V_out,4: Triangular activation functions (blue).
#### c. Action Potential Graphs
- **Trends**:
- **In vivo**: Sharpest peak at ~2 ms (40 mV).
- **In vitro**: Slightly delayed peak (~2.5 ms, 35 mV).
- **Model**: Broadest peak (~2.2 ms, 30 mV).
- **Notable**:
- All graphs show a rapid depolarization phase followed by repolarization.
- The *model* graph has the lowest amplitude, suggesting simplified ion channel dynamics.
---
### Key Observations
1. **Neuron-to-Network Mapping**:
- Dendrites (inputs) → Hidden layer nodes (V_out).
- Axon (output) → Output layer nodes (V_out).
2. **Action Potential Consistency**:
- Peaks align temporally (~2 ms) across all conditions, validating the model's accuracy.
3. **Activation Patterns**:
- Input layer nodes show decreasing activation (V_in,1 > V_in,2 > V_in,3 > V_in,4).
---
### Interpretation
1. **Biological Inspiration for AI**:
- The neuron diagram (a) directly maps to the artificial network (b), illustrating how biological neurons inspire computational architectures.
2. **Action Potential Dynamics**:
- The *in vivo* graph (red) reflects the most realistic membrane potential, while the *model* (black) simplifies ion channel behavior.
3. **Network Activation**:
- The input layer's decreasing activation (V_in,1 to V_in,4) suggests a gradient of signal strength, mirrored in the hidden layer's output (V_out,1 to V_out,4).
4. **Practical Implications**:
- The *in vitro* data (blue) bridges biological and simulated systems, showing how isolated neurons behave compared to whole organisms.
This diagram underscores the interplay between biological neuroscience and artificial intelligence, demonstrating how action potential models validate computational simulations of neural activity.