## Pressure-Temperature Phase Diagram
### Overview
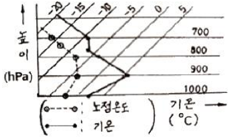
The image depicts a pressure-temperature (P-T) phase diagram with pressure (hPa) on the vertical axis and temperature (°C) on the horizontal axis. The diagram includes two distinct data series represented by dashed and solid lines, along with labeled pressure isotherms and temperature markers. The legend identifies the lines as "고정온도" (fixed temperature) and "기온" (temperature).
### Components/Axes
- **Y-Axis (Pressure)**: Labeled "압력 (hPa)" with values ranging from 700 to 1000 hPa in 100 hPa increments.
- **X-Axis (Temperature)**: Labeled "기온 (°C)" with markers at -20, -15, -10, -5, 0, and 5°C.
- **Legend**: Located at the bottom, with:
- **Dashed Line**: "고정온도" (fixed temperature)
- **Solid Line**: "기온" (temperature)
### Detailed Analysis
1. **Pressure Isotherms**:
- Horizontal lines labeled 700, 800, 900, and 1000 hPa span the graph, indicating constant-pressure contours.
2. **Data Series**:
- **Dashed Line ("고정온도")**:
- Connects points at (-20°C, 700 hPa), (-15°C, 800 hPa), (-10°C, 900 hPa), and (-5°C, 1000 hPa).
- Exhibits a **negative slope**, suggesting an inverse relationship between temperature and pressure for this series.
- **Solid Line ("기온")**:
- Starts at (-20°C, 700 hPa) and ascends to (5°C, 1000 hPa).
- Shows a **positive slope**, indicating a direct relationship between temperature and pressure.
3. **Intersection**:
- The two lines intersect at approximately (-10°C, 900 hPa), forming a triangular region between the dashed and solid lines.
### Key Observations
- The dashed line ("고정온도") decreases in pressure as temperature increases, while the solid line ("기온") increases in pressure with rising temperature.
- The triangular region between the lines suggests a phase transition zone or critical boundary.
- Pressure isotherms (700–1000 hPa) are evenly spaced, implying uniform pressure increments.
### Interpretation
This diagram likely represents thermodynamic behavior, such as phase changes (e.g., liquid-vapor equilibrium) or material properties under varying conditions. The "고정온도" (fixed temperature) line may depict isothermal processes, while "기온" (temperature) could represent adiabatic or dynamic processes. The intersection at (-10°C, 900 hPa) might correspond to a critical point where phase transitions occur, such as the boiling point of a substance under specific pressure. The negative slope of the dashed line contrasts with the positive slope of the solid line, highlighting divergent behaviors under fixed vs. variable temperature conditions.