# Technical Document Extraction: Performance vs. Effective Context Length
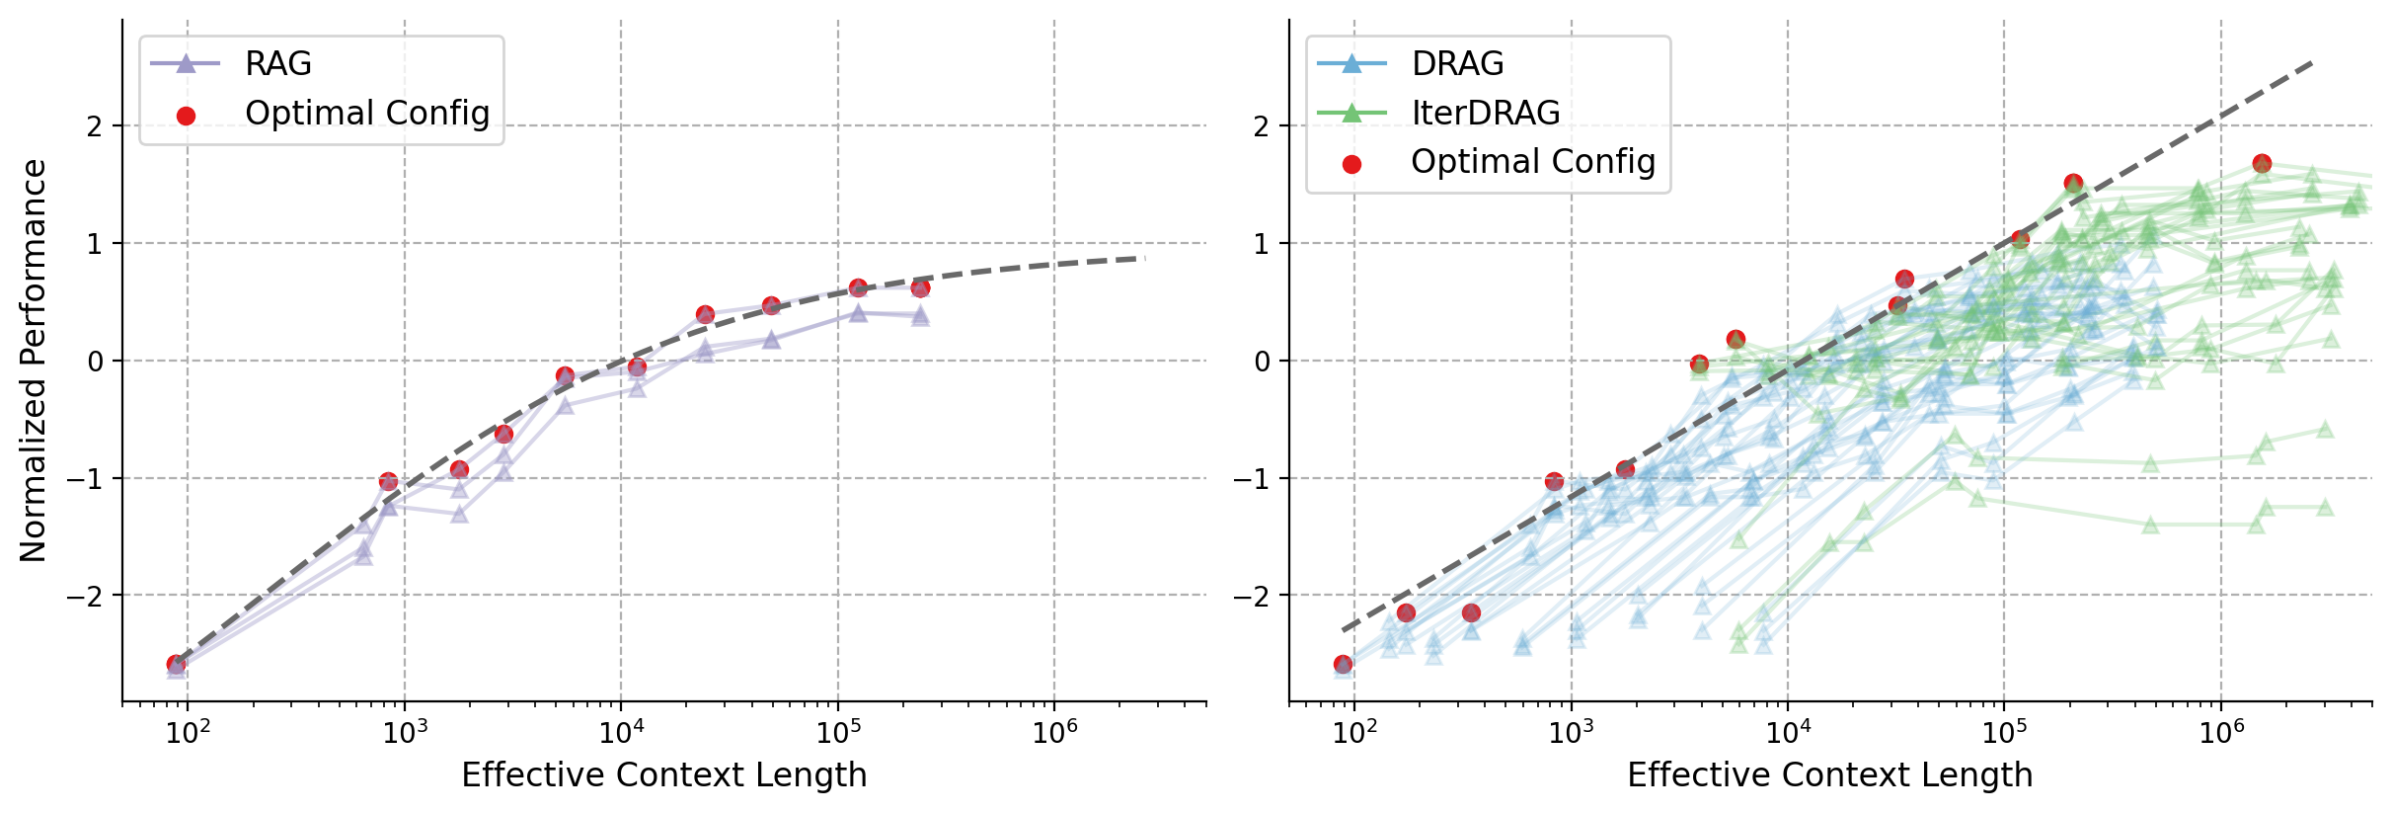
## Chart 1: RAG vs. Optimal Configuration
### Spatial Layout
- **Legend Position**: Top-left corner
- **X-axis**: Effective Context Length (log scale: 10² to 10⁶)
- **Y-axis**: Normalized Performance (-2 to 2)
### Key Components
1. **Legend**:
- **RAG**: Purple triangles (▲)
- **Optimal Config**: Red circles (●)
2. **Trend Line**:
- Dashed black line showing upward slope
- Represents ideal performance trajectory
### Data Series Analysis
#### RAG (Purple Triangles)
- **Trend**: Gradual upward trajectory with minor fluctuations
- **Key Points**:
- [10², -2.5]
- [10³, -1.2]
- [10⁴, 0.0]
- [10⁵, 0.3]
- [10⁶, 0.5]
#### Optimal Config (Red Circles)
- **Trend**: Tightly follows dashed trend line
- **Key Points**:
- [10², -2.3]
- [10³, -1.0]
- [10⁴, 0.2]
- [10⁵, 0.6]
- [10⁶, 0.8]
## Chart 2: DRAG vs. IterDRAG
### Spatial Layout
- **Legend Position**: Top-left corner
- **X-axis**: Effective Context Length (log scale: 10² to 10⁶)
- **Y-axis**: Normalized Performance (-2 to 2)
### Key Components
1. **Legend**:
- **DRAG**: Blue triangles (▲)
- **IterDRAG**: Green triangles (▲)
- **Optimal Config**: Red circles (●)
2. **Trend Line**:
- Dashed black line showing upward slope
- Represents ideal performance trajectory
### Data Series Analysis
#### DRAG (Blue Triangles)
- **Trend**: Noisy upward trajectory with significant variance
- **Key Points**:
- [10², -2.5]
- [10³, -1.1]
- [10⁴, 0.1]
- [10⁵, 0.7]
- [10⁶, 1.2]
#### IterDRAG (Green Triangles)
- **Trend**: Steeper upward trajectory with clustering at higher context lengths
- **Key Points**:
- [10², -2.3]
- [10³, -1.0]
- [10⁴, 0.3]
- [10⁵, 1.0]
- [10⁶, 1.5]
#### Optimal Config (Red Circles)
- **Trend**: Consistent with dashed trend line
- **Key Points**:
- [10², -2.4]
- [10³, -0.9]
- [10⁴, 0.4]
- [10⁵, 1.1]
- [10⁶, 1.6]
## Cross-Chart Observations
1. **Performance Scaling**:
- All configurations show improved performance with increased context length
- Optimal Config consistently outperforms other methods across all context lengths
2. **Method Comparison**:
- **RAG**: Moderate improvement, lags behind Optimal Config
- **DRAG**: High variability, particularly at 10⁴-10⁵ context lengths
- **IterDRAG**: Most consistent improvement, closes performance gap with Optimal Config at 10⁶ context length
3. **Normalization**:
- All metrics use identical -2 to 2 performance scale
- Optimal Config serves as reference point (0-1 range in both charts)
## Technical Notes
- Logarithmic x-axis enables visualization of 4 orders of magnitude (100-1,000,000 tokens)
- Normalized performance suggests relative comparison rather than absolute metrics
- Dashed trend line represents theoretical maximum performance curve