# Technical Data Extraction: Performance vs. Effective Context Length
This document provides a detailed technical extraction of the data and trends presented in the provided image, which consists of two side-by-side line charts comparing different Retrieval-Augmented Generation (RAG) configurations.
## 1. General Chart Metadata
* **X-Axis (Common):** "Effective Context Length"
* **Scale:** Logarithmic ($10^2$ to $10^6$).
* **Major Tick Marks:** $10^2, 10^3, 10^4, 10^5, 10^6$.
* **Y-Axis (Common):** "Normalized Performance"
* **Scale:** Linear (from -2 to 2).
* **Major Tick Marks:** -2, -1, 0, 1, 2.
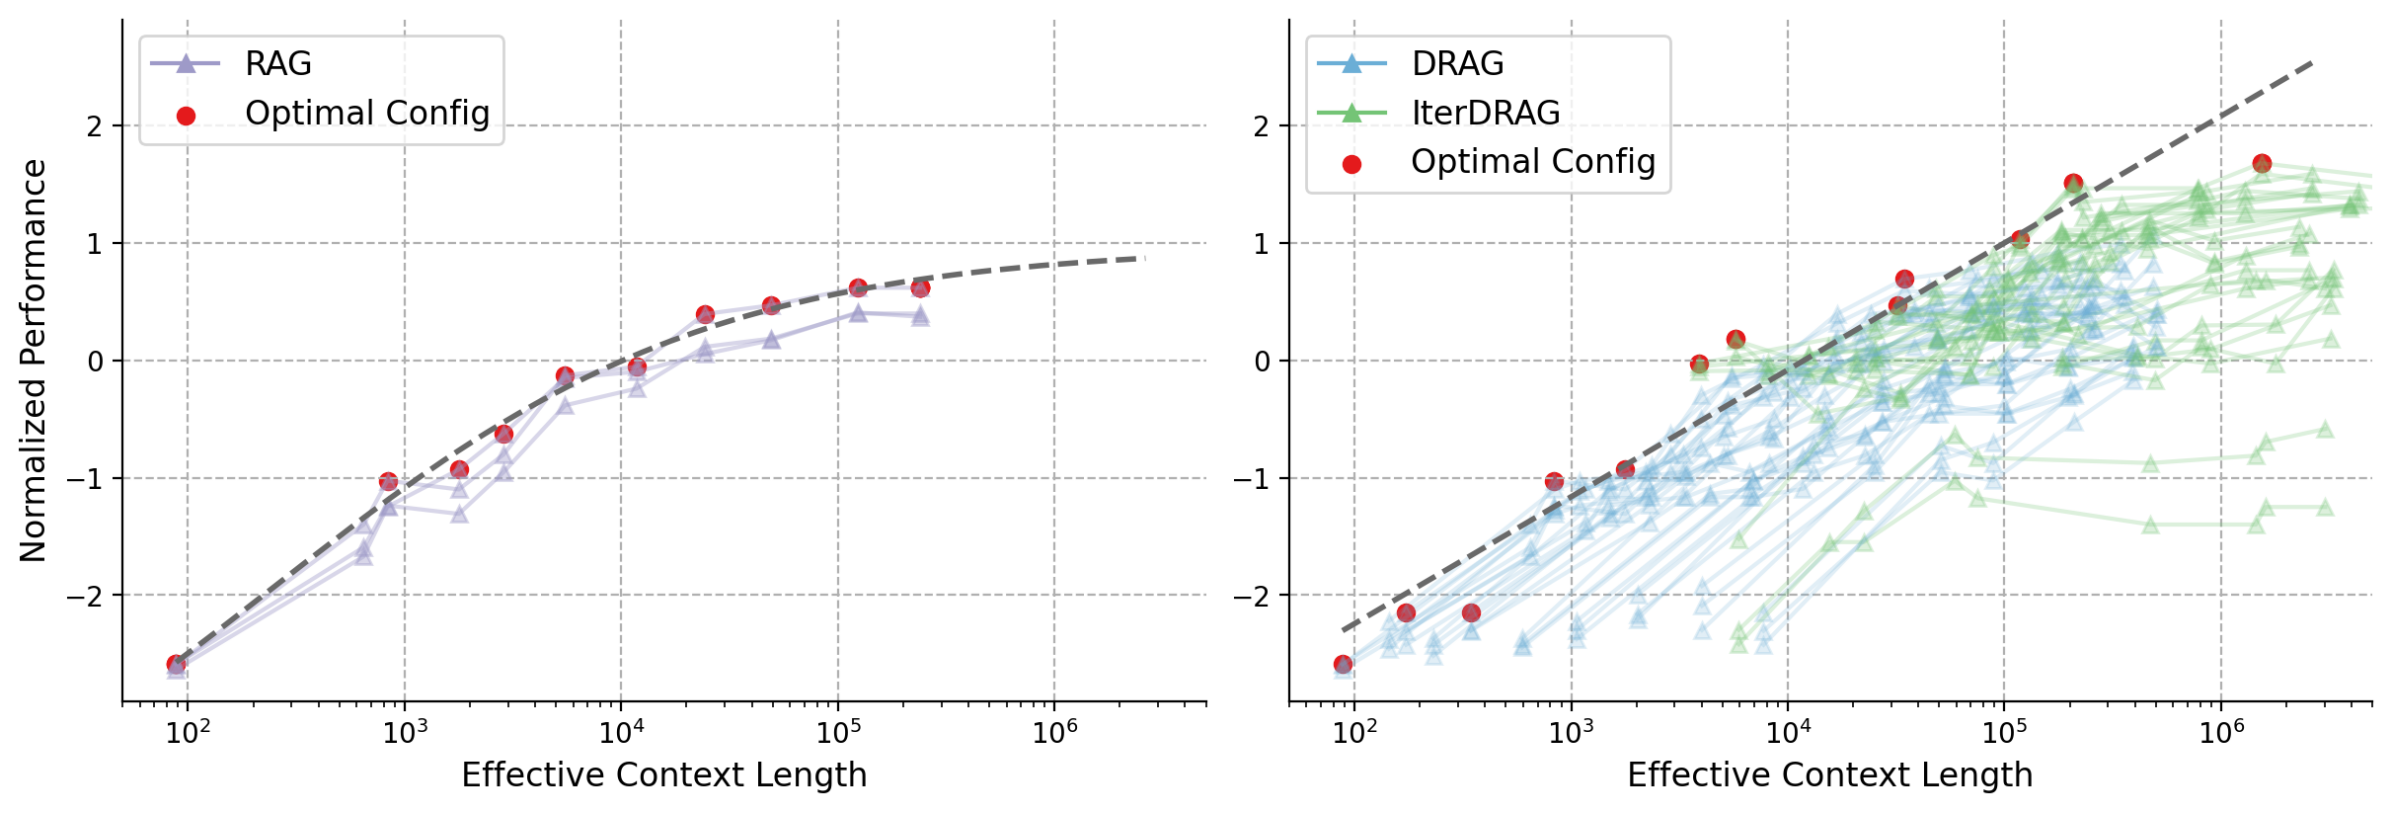
* **Visual Elements:** Both charts feature a dashed grey trend line representing the theoretical or empirical upper bound of performance as context length increases. Red circular dots represent the "Optimal Config" at specific context intervals.
---
## 2. Left Chart: RAG Performance
### Component Isolation: Left Panel
* **Legend Location:** Top-left $[x \approx 0.05, y \approx 0.90]$
* **Legend Items:**
* **RAG:** Light purple line with triangle markers ($\triangle$).
* **Optimal Config:** Red circular markers ($\bullet$).
### Trend Verification: RAG
The RAG data series consists of multiple faint purple lines representing different sub-configurations, with one primary line highlighted.
* **Visual Trend:** The performance starts at its lowest point at $10^2$ context length and follows a logarithmic growth curve. The slope is steepest between $10^2$ and $10^3$, then gradually flattens (plateaus) as it approaches $10^5$ and $10^6$.
* **Saturation:** Performance appears to saturate around a normalized value of $0.5$ to $0.8$ as context length exceeds $10^5$.
### Data Point Extraction (Approximate)
| Effective Context Length | Normalized Performance (Optimal Config - Red Dot) |
| :--- | :--- |
| $\approx 10^2$ | -2.6 |
| $\approx 8 \times 10^2$ | -1.0 |
| $\approx 2 \times 10^3$ | -0.9 |
| $\approx 3 \times 10^3$ | -0.6 |
| $\approx 6 \times 10^3$ | -0.1 |
| $\approx 10^4$ | 0.0 |
| $\approx 2 \times 10^4$ | 0.4 |
| $\approx 5 \times 10^4$ | 0.5 |
| $\approx 10^5$ | 0.6 |
| $\approx 2 \times 10^5$ | 0.6 |
---
## 3. Right Chart: DRAG and IterDRAG Performance
### Component Isolation: Right Panel
* **Legend Location:** Top-left $[x \approx 0.55, y \approx 0.90]$
* **Legend Items:**
* **DRAG:** Light blue line with triangle markers ($\triangle$).
* **IterDRAG:** Light green line with triangle markers ($\triangle$).
* **Optimal Config:** Red circular markers ($\bullet$).
### Trend Verification: DRAG & IterDRAG
* **DRAG (Blue):** Multiple blue lines show a similar upward trend to the standard RAG but extend further into the higher context lengths.
* **IterDRAG (Green):** These lines generally start at higher context lengths (beginning around $5 \times 10^3$). They show a higher performance ceiling than the standard RAG, continuing to climb past the $1.0$ normalized performance mark.
* **Overall Trend:** Unlike the left chart which plateaus, the right chart shows continued performance growth. The "Optimal Config" dots follow the dashed grey line much more closely and for a longer duration, reaching a peak performance near $1.8$ at context lengths exceeding $10^6$.
### Data Point Extraction (Approximate)
| Effective Context Length | Normalized Performance (Optimal Config - Red Dot) |
| :--- | :--- |
| $\approx 10^2$ | -2.6 |
| $\approx 2 \times 10^2$ | -2.2 |
| $\approx 4 \times 10^2$ | -2.2 |
| $\approx 9 \times 10^2$ | -1.1 |
| $\approx 2 \times 10^3$ | -0.9 |
| $\approx 4 \times 10^3$ | 0.0 |
| $\approx 6 \times 10^3$ | 0.2 |
| $\approx 3 \times 10^4$ | 0.5 |
| $\approx 4 \times 10^4$ | 0.7 |
| $\approx 10^5$ | 1.1 |
| $\approx 2 \times 10^5$ | 1.5 |
| $\approx 2 \times 10^6$ | 1.7 |
---
## 4. Comparative Summary
* **Performance Ceiling:** The standard RAG (Left) plateaus significantly earlier (around $10^5$ context length) with a maximum normalized performance below 1.0.
* **Scalability:** The DRAG and IterDRAG methods (Right) demonstrate superior scalability. They continue to improve performance as context length increases toward $10^6$, nearly doubling the peak performance of the standard RAG.
* **Optimal Configuration Alignment:** In the right chart, the "Optimal Config" points track the theoretical dashed line much more accurately at high context lengths compared to the left chart, where the optimal points begin to fall below the dashed line after $10^4$.