\n
## Diagram: Forensic Image Analysis Pipeline
### Overview
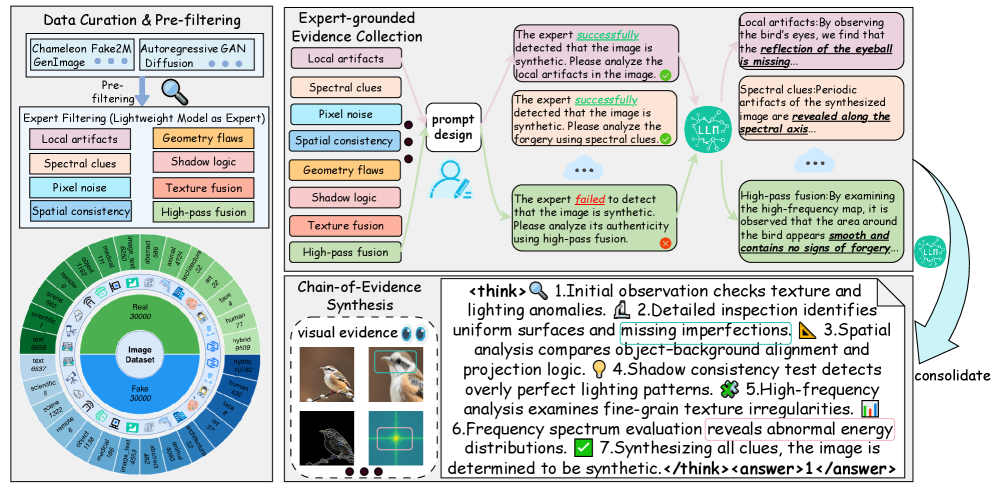
This diagram illustrates a pipeline for forensic analysis of images, specifically focusing on detecting whether an image is real or synthetically generated (e.g., by a GAN). The pipeline consists of data curation & pre-filtering, expert-grounded evidence collection, chain-of-evidence synthesis, and consolidation stages. It highlights various clues and analysis techniques used to determine image authenticity. The diagram also includes example outputs and textual explanations of the analysis process.
### Components/Axes
The diagram is structured into four main sections, flowing from left to right:
1. **Data Curation & Pre-filtering:** Includes "Chameleon Fake2M", "Gen1mage", "Autoregressive GAN", "Diffusion", and "Pre-filtering".
2. **Expert-grounded Evidence Collection:** Contains two columns of analysis types: "Local artifacts", "Spectral clues", "Pixel noise", "Spatial consistency" and "Geometry flaws", "Shadow logic", "Texture fusion", "High-pass fusion".
3. **Chain-of-Evidence Synthesis:** Labeled as "Chain-of-Evidence Synthesis" with an arrow pointing to "visual evidence".
4. **Consolidation:** Contains a series of numbered steps within `` tags.
There is also a circular chart at the bottom-left labeled "Image Dataset" with categories "Real" and "Fake".
Textual annotations are present throughout the diagram, providing explanations of the analysis steps and findings.
### Detailed Analysis or Content Details
**1. Data Curation & Pre-filtering:**
* "Chameleon Fake2M" and "Gen1mage" are listed as sources of synthetic images.
* "Autoregressive GAN" and "Diffusion" are listed as image generation methods.
* "Pre-filtering" is a step to prepare the images for further analysis.
* "Expert Filtering (Lightweight Model as Expert)" is a step to filter images.
**2. Expert-grounded Evidence Collection:**
* The left column lists clues: "Local artifacts", "Spectral clues", "Pixel noise", "Spatial consistency".
* The right column lists analysis techniques: "Geometry flaws", "Shadow logic", "Texture fusion", "High-pass fusion".
* Text boxes within this section provide examples of findings:
* "The expert successfully detected that the image is synthetic. Please analyze the local artifacts in the image."
* "The expert successfully detected that the image is synthetic. Please analyze the forgery using spectral clues."
* "The expert failed to detect that the image is synthetic. Please analyze its authenticity using high-pass fusion."
**3. Chain-of-Evidence Synthesis:**
* This section is labeled "Chain-of-Evidence Synthesis" and connects to "visual evidence".
**4. Consolidation:**
* The following steps are listed within `` tags:
1. "Initial observation checks texture and lighting anomalies."
2. "Detailed inspection identifies uniform surfaces and missing imperfections."
3. "Spatial analysis compares object-background alignment and projection logic."
4. "Shadow consistency test detects overly perfect lighting patterns."
5. "High-frequency analysis examines fine-grain texture irregularities."
6. "Frequency spectrum evaluation reveals abnormal energy distributions."
7. "Synthesizing all clues, the image is determined to be synthetic."
**5. Image Dataset Chart:**
* The chart is a semi-circular distribution.
* The "Real" category occupies approximately the upper-right quadrant, with a value around 30000.
* The "Fake" category occupies the lower-left quadrant, with a value around 3000.
* There is a section labeled "hybrid" with a value around 2000.
* The chart also shows a distribution of "image quality" or "confidence" levels, with varying shades of green and red.
**6. Textual Annotations:**
* "Local artifacts: By observing the bird's eyes, we find that the reflection of the eyeball is missing."
* "Spectral clues: Periodic artifacts of the synthesized image are revealed along the spectral axis."
* "High-pass fusion: By examining the high-frequency map, it is observed that the area around the bird appears smooth and contains no signs of forgery."
### Key Observations
* The pipeline emphasizes a multi-faceted approach to image forensics, combining various clues and analysis techniques.
* The "Expert-grounded Evidence Collection" section highlights the importance of both local and global image features.
* The consolidation steps demonstrate a logical progression from initial observation to final determination of image authenticity.
* The Image Dataset chart shows a clear imbalance between real and fake images, with a significantly larger number of real images.
* The textual annotations provide specific examples of how different clues can be used to detect synthetic images.
### Interpretation
The diagram presents a comprehensive framework for detecting synthetic images. The pipeline's strength lies in its integration of multiple analysis techniques, allowing for a more robust and reliable assessment of image authenticity. The use of "expert-grounded evidence" suggests a reliance on human expertise combined with automated analysis. The consolidation steps demonstrate a clear reasoning process, culminating in a final determination of whether an image is real or fake.
The imbalance in the Image Dataset chart (30000 real vs. 3000 fake) could indicate a bias in the training data or a limited number of available synthetic images. The textual annotations provide valuable insights into the specific types of artifacts that can be used to identify synthetic images, such as missing reflections in eyes or periodic artifacts in spectral analysis. The diagram suggests that even when initial analysis fails to detect forgery, further investigation using techniques like high-pass fusion can reveal subtle clues.
The `` tags around the consolidation steps suggest a deliberate attempt to model the thought process of a forensic analyst, making the pipeline more transparent and explainable. The overall message is that detecting synthetic images requires a careful and systematic approach, combining technical analysis with human judgment.