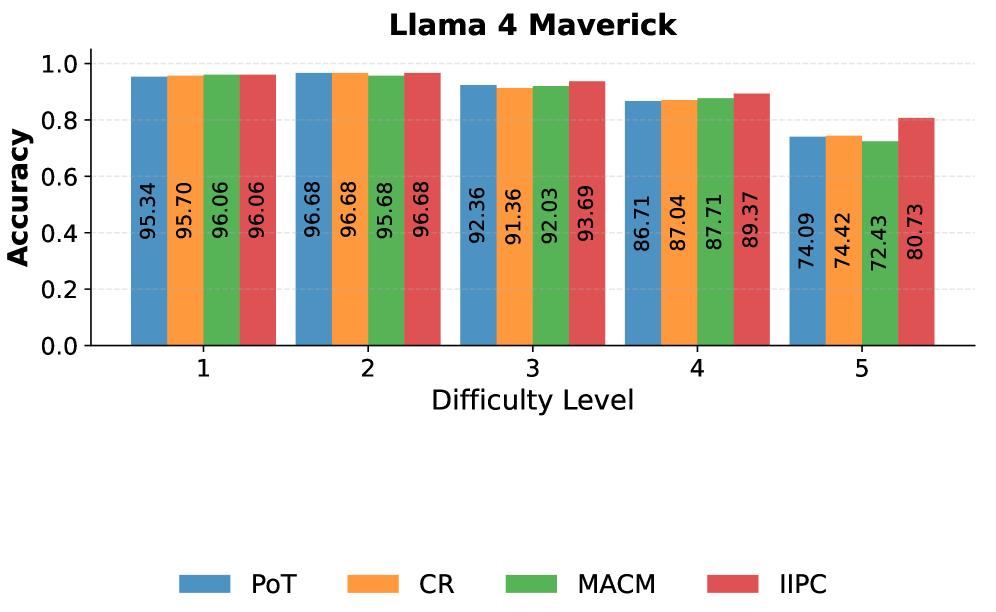
## Bar Chart: Llama 4 Maverick Accuracy vs. Difficulty Level
### Overview
The image is a bar chart comparing the accuracy of four different methods (PoT, CR, MACM, and IIPC) across five difficulty levels. The y-axis represents accuracy, ranging from 0.0 to 1.0, and the x-axis represents the difficulty level, ranging from 1 to 5. Each method has a distinct color, and their accuracy is displayed as a bar for each difficulty level.
### Components/Axes
* **Title:** Llama 4 Maverick
* **Y-axis:**
* Label: Accuracy
* Scale: 0.0 to 1.0, with gridlines at intervals of 0.2.
* **X-axis:**
* Label: Difficulty Level
* Scale: 1 to 5, with each integer representing a difficulty level.
* **Legend:** Located at the bottom of the chart.
* PoT (Blue)
* CR (Orange)
* MACM (Green)
* IIPC (Red)
### Detailed Analysis
The chart presents the accuracy of four methods (PoT, CR, MACM, and IIPC) across five difficulty levels.
* **Difficulty Level 1:**
* PoT (Blue): 95.34
* CR (Orange): 95.70
* MACM (Green): 96.06
* IIPC (Red): 96.06
* **Difficulty Level 2:**
* PoT (Blue): 96.68
* CR (Orange): 96.68
* MACM (Green): 95.68
* IIPC (Red): 96.68
* **Difficulty Level 3:**
* PoT (Blue): 92.36
* CR (Orange): 91.36
* MACM (Green): 92.03
* IIPC (Red): 93.69
* **Difficulty Level 4:**
* PoT (Blue): 86.71
* CR (Orange): 87.04
* MACM (Green): 87.71
* IIPC (Red): 89.37
* **Difficulty Level 5:**
* PoT (Blue): 74.09
* CR (Orange): 74.42
* MACM (Green): 72.43
* IIPC (Red): 80.73
**Trend Verification:**
All four methods show a general downward trend in accuracy as the difficulty level increases.
### Key Observations
* The accuracy of all four methods is highest at difficulty levels 1 and 2.
* The accuracy of all four methods decreases as the difficulty level increases from 3 to 5.
* IIPC (Red) consistently has the lowest drop in accuracy compared to the other methods as difficulty increases, especially noticeable at difficulty level 5.
* MACM (Green) has the lowest accuracy at difficulty level 5.
### Interpretation
The bar chart illustrates the performance of four different methods (PoT, CR, MACM, and IIPC) in terms of accuracy across varying difficulty levels. The data suggests that all methods perform well at lower difficulty levels (1 and 2), with accuracy scores generally above 95%. However, as the difficulty level increases, the accuracy of all methods declines, indicating that they struggle more with more complex tasks.
The IIPC method (red) appears to be more resilient to increasing difficulty compared to the other methods, as its accuracy decreases at a slower rate. This is particularly evident at difficulty level 5, where IIPC's accuracy is significantly higher than the other methods. This suggests that IIPC may be a more robust method for handling complex tasks.
The consistent decline in accuracy across all methods as difficulty increases highlights the challenge of maintaining performance as tasks become more complex. Further investigation into the specific characteristics of each method and the nature of the tasks at each difficulty level could provide valuable insights into the strengths and weaknesses of each approach.