\n
## Bar Chart: Llama 4 Maverick Accuracy vs. Difficulty Level
### Overview
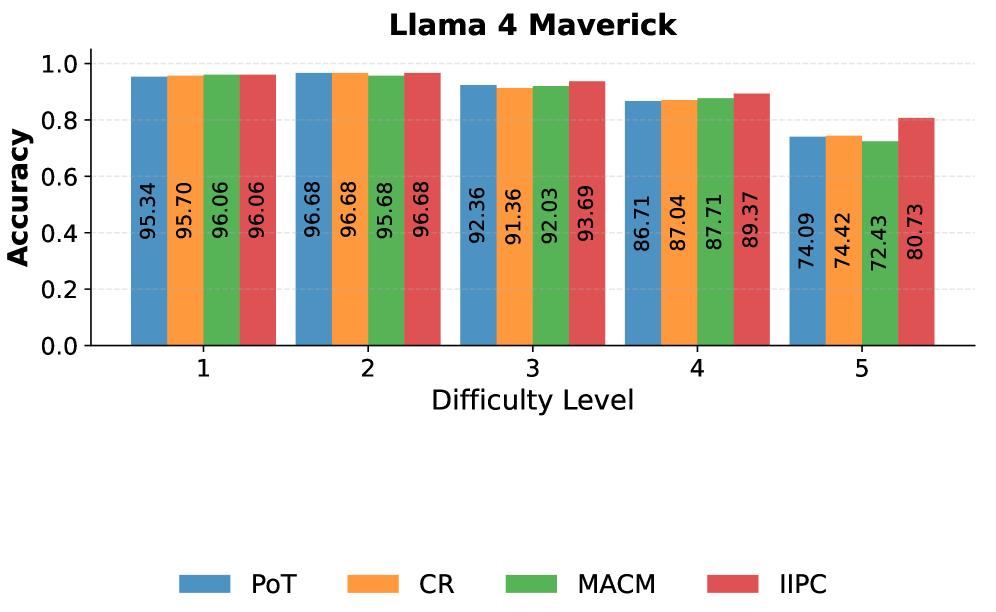
This bar chart displays the accuracy scores of the Llama 4 Maverick model across five different difficulty levels. Four different evaluation metrics are used: PoT, CR, MACM, and IIPC. The chart uses grouped bar representations for each metric at each difficulty level.
### Components/Axes
* **Title:** Llama 4 Maverick
* **X-axis:** Difficulty Level (ranging from 1 to 5)
* **Y-axis:** Accuracy (ranging from 0.0 to 1.0)
* **Legend:** Located at the bottom of the chart, identifying the four evaluation metrics with corresponding colors:
* PoT (Light Blue)
* CR (Orange)
* MACM (Medium Green)
* IIPC (Red)
### Detailed Analysis
The chart consists of five groups of bars, one for each difficulty level. Within each group, there are four bars representing the accuracy scores for each metric.
**Difficulty Level 1:**
* PoT: Approximately 95.34%
* CR: Approximately 95.70%
* MACM: Approximately 96.06%
* IIPC: Approximately 96.68%
**Difficulty Level 2:**
* PoT: Approximately 96.68%
* CR: Approximately 96.68%
* MACM: Approximately 96.68%
* IIPC: Approximately 95.68%
**Difficulty Level 3:**
* PoT: Approximately 92.36%
* CR: Approximately 91.36%
* MACM: Approximately 92.03%
* IIPC: Approximately 93.69%
**Difficulty Level 4:**
* PoT: Approximately 86.71%
* CR: Approximately 87.04%
* MACM: Approximately 87.71%
* IIPC: Approximately 89.37%
**Difficulty Level 5:**
* PoT: Approximately 74.09%
* CR: Approximately 74.42%
* MACM: Approximately 72.43%
* IIPC: Approximately 80.73%
**Trends:**
* For all metrics, accuracy generally decreases as the difficulty level increases.
* The most significant drop in accuracy occurs between difficulty levels 4 and 5.
* At difficulty levels 1 and 2, all metrics show very high accuracy (above 95%).
* MACM and CR generally have slightly higher accuracy scores than PoT and IIPC at lower difficulty levels.
### Key Observations
* The model performs exceptionally well on easier tasks (difficulty levels 1 and 2).
* Accuracy declines noticeably as the difficulty increases, particularly at level 5.
* IIPC shows the largest variance in accuracy across difficulty levels.
* The differences in accuracy between the metrics are relatively small, suggesting they all provide similar assessments of the model's performance.
### Interpretation
The data suggests that the Llama 4 Maverick model is highly capable on simpler tasks but struggles with more complex ones. The consistent decline in accuracy with increasing difficulty indicates a limitation in the model's ability to generalize to challenging scenarios. The relatively small differences between the metrics suggest that they are all measuring similar aspects of the model's performance. The significant drop in accuracy at difficulty level 5 could indicate a point where the model's limitations become more pronounced, or where the evaluation tasks become fundamentally different in nature. Further investigation into the specific tasks at difficulty level 5 would be needed to understand the reasons for this decline. The chart provides a clear visualization of the model's performance characteristics and highlights areas where further improvement may be needed.