## Grouped Bar Chart: Llama 4 Maverick Accuracy by Difficulty Level
### Overview
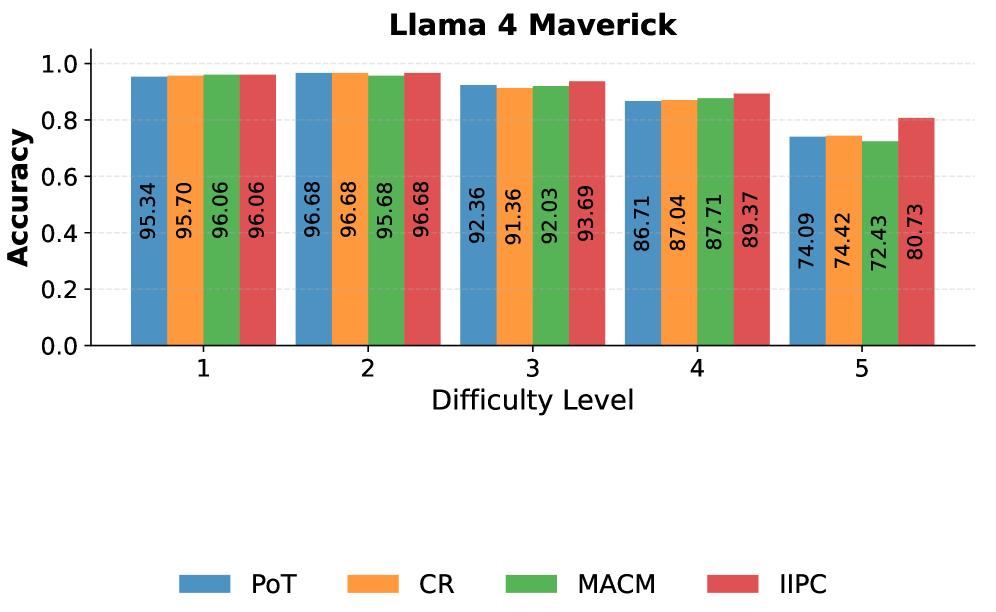
This image is a grouped bar chart titled "Llama 4 Maverick." It displays the accuracy performance of four different methods (PoT, CR, MACM, IIPC) across five increasing difficulty levels. The chart shows a clear trend of decreasing accuracy for all methods as the difficulty level increases.
### Components/Axes
* **Chart Title:** "Llama 4 Maverick" (centered at the top).
* **Y-Axis:** Labeled "Accuracy". The scale runs from 0.0 to 1.0, with major gridlines at 0.0, 0.2, 0.4, 0.6, 0.8, and 1.0.
* **X-Axis:** Labeled "Difficulty Level". It contains five discrete categories: 1, 2, 3, 4, and 5.
* **Legend:** Positioned at the bottom center of the chart. It defines four data series by color:
* **Blue:** PoT
* **Orange:** CR
* **Green:** MACM
* **Red:** IIPC
* **Data Labels:** Each bar has its exact accuracy value printed vertically inside it.
### Detailed Analysis
The chart presents accuracy values for each method at each difficulty level. The data is as follows:
**Difficulty Level 1:**
* PoT (Blue): 95.34
* CR (Orange): 95.70
* MACM (Green): 96.06
* IIPC (Red): 96.06
* *Trend:* All methods perform very similarly, with accuracy clustered tightly between ~95.3 and 96.1.
**Difficulty Level 2:**
* PoT (Blue): 96.68
* CR (Orange): 96.68
* MACM (Green): 95.68
* IIPC (Red): 96.68
* *Trend:* Performance remains high. PoT, CR, and IIPC are tied at the highest value. MACM is slightly lower.
**Difficulty Level 3:**
* PoT (Blue): 92.36
* CR (Orange): 91.36
* MACM (Green): 92.03
* IIPC (Red): 93.69
* *Trend:* A noticeable drop in accuracy for all methods compared to levels 1 and 2. IIPC shows the highest accuracy.
**Difficulty Level 4:**
* PoT (Blue): 86.71
* CR (Orange): 87.04
* MACM (Green): 87.71
* IIPC (Red): 89.37
* *Trend:* Accuracy continues to decline for all series. IIPC maintains a lead of approximately 1.6-2.7 points over the others.
**Difficulty Level 5:**
* PoT (Blue): 74.09
* CR (Orange): 74.42
* MACM (Green): 72.43
* IIPC (Red): 80.73
* *Trend:* The most significant drop occurs here. IIPC demonstrates a clear performance advantage, being the only method to remain above 80% accuracy. MACM shows the lowest performance.
### Key Observations
1. **Universal Performance Degradation:** All four methods (PoT, CR, MACM, IIPC) exhibit a consistent downward trend in accuracy as the difficulty level increases from 1 to 5.
2. **IIPC Superiority:** The IIPC method (red bars) consistently achieves the highest or tied-for-highest accuracy at every single difficulty level. Its advantage becomes most pronounced at the highest difficulty (Level 5), where it outperforms the next best method (CR) by over 6 percentage points.
3. **MACM Vulnerability:** The MACM method (green bars) tends to be the lowest-performing or among the lowest at higher difficulties, showing the sharpest decline at Level 5 (72.43).
4. **Clustering at Low Difficulty:** At Difficulty Levels 1 and 2, the performance of all four methods is very tightly clustered, with differences of less than 1.5 percentage points.
### Interpretation
This chart evaluates the robustness of the "Llama 4 Maverick" system (or components thereof) under increasing task difficulty. The data suggests that while all tested methods struggle as problems become harder, the **IIPC method is the most robust and scalable**, maintaining a significant performance buffer at the highest difficulty tier. The near-identical performance at low difficulty levels indicates that for simple tasks, the choice of method may be less critical. However, for complex applications, employing the IIPC approach would likely yield the best results. The consistent ranking (IIPC > others, with MACM often trailing) provides a clear hierarchy of method effectiveness for this specific evaluation.