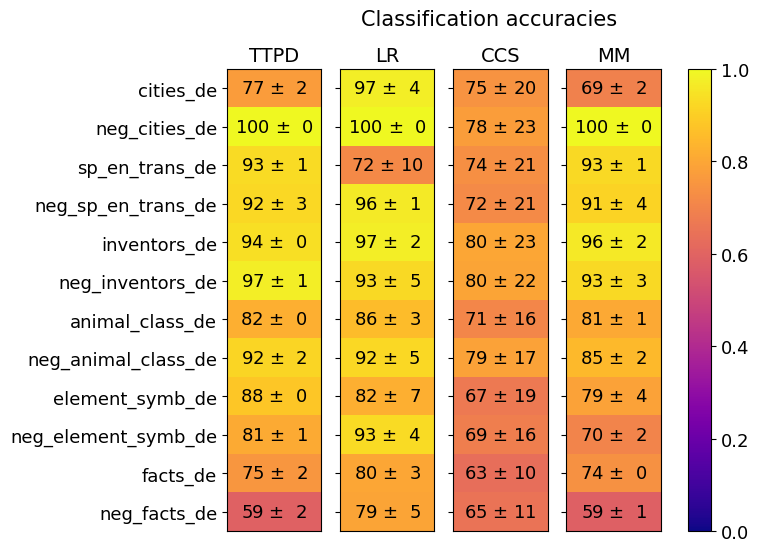
## Heatmap: Classification Accuracies
### Overview
The image is a heatmap displaying classification accuracies for different models (TTPD, LR, CCS, MM) across various categories (e.g., cities_de, neg_cities_de). The heatmap uses a color gradient from blue (low accuracy) to yellow (high accuracy) to represent the accuracy values. Each cell contains the accuracy value and its associated uncertainty (± value).
### Components/Axes
* **Title:** Classification accuracies
* **Columns (Models):** TTPD, LR, CCS, MM
* **Rows (Categories):** cities\_de, neg\_cities\_de, sp\_en\_trans\_de, neg\_sp\_en\_trans\_de, inventors\_de, neg\_inventors\_de, animal\_class\_de, neg\_animal\_class\_de, element\_symb\_de, neg\_element\_symb\_de, facts\_de, neg\_facts\_de
* **Colorbar:** Ranges from 0.0 (blue) to 1.0 (yellow), representing the classification accuracy score.
### Detailed Analysis
The heatmap presents classification accuracies as percentages, with an associated uncertainty value.
Here's a breakdown of the data, organized by category and model:
* **cities\_de:**
* TTPD: 77 ± 2
* LR: 97 ± 4
* CCS: 75 ± 20
* MM: 69 ± 2
* **neg\_cities\_de:**
* TTPD: 100 ± 0
* LR: 100 ± 0
* CCS: 78 ± 23
* MM: 100 ± 0
* **sp\_en\_trans\_de:**
* TTPD: 93 ± 1
* LR: 72 ± 10
* CCS: 74 ± 21
* MM: 93 ± 1
* **neg\_sp\_en\_trans\_de:**
* TTPD: 92 ± 3
* LR: 96 ± 1
* CCS: 72 ± 21
* MM: 91 ± 4
* **inventors\_de:**
* TTPD: 94 ± 0
* LR: 97 ± 2
* CCS: 80 ± 23
* MM: 96 ± 2
* **neg\_inventors\_de:**
* TTPD: 97 ± 1
* LR: 93 ± 5
* CCS: 80 ± 22
* MM: 93 ± 3
* **animal\_class\_de:**
* TTPD: 82 ± 0
* LR: 86 ± 3
* CCS: 71 ± 16
* MM: 81 ± 1
* **neg\_animal\_class\_de:**
* TTPD: 92 ± 2
* LR: 92 ± 5
* CCS: 79 ± 17
* MM: 85 ± 2
* **element\_symb\_de:**
* TTPD: 88 ± 0
* LR: 82 ± 7
* CCS: 67 ± 19
* MM: 79 ± 4
* **neg\_element\_symb\_de:**
* TTPD: 81 ± 1
* LR: 93 ± 4
* CCS: 69 ± 16
* MM: 70 ± 2
* **facts\_de:**
* TTPD: 75 ± 2
* LR: 80 ± 3
* CCS: 63 ± 10
* MM: 74 ± 0
* **neg\_facts\_de:**
* TTPD: 59 ± 2
* LR: 79 ± 5
* CCS: 65 ± 11
* MM: 59 ± 1
### Key Observations
* LR consistently shows high accuracy across most categories.
* CCS generally has lower accuracy and higher uncertainty compared to other models.
* TTPD and MM perform similarly, with some variations depending on the category.
* All models struggle with the "neg\_facts\_de" category, showing the lowest accuracies.
* All models perform very well on "neg_cities_de"
### Interpretation
The heatmap provides a visual comparison of the classification accuracies of four different models across a range of categories. The data suggests that the LR model generally outperforms the others, while the CCS model tends to have lower accuracy and higher variance. The "neg\_facts\_de" category appears to be the most challenging for all models, indicating a potential area for improvement. The high accuracy on "neg_cities_de" suggests this is an easy category for all models. The uncertainty values highlight the variability in the model's performance, with CCS showing the highest uncertainty in several categories.