\n
## Heatmap Chart: Classification Accuracies
### Overview
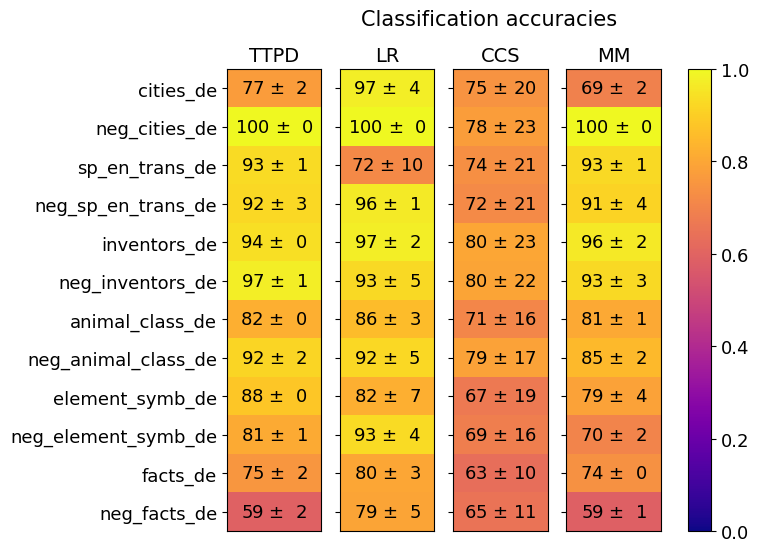
This image is a heatmap chart titled "Classification accuracies." It displays the performance (accuracy scores with standard deviations) of four different classification methods (TTPD, LR, CCS, MM) across twelve distinct datasets. The performance is encoded both numerically within each cell and by a color gradient, with yellow indicating higher accuracy (closer to 1.0) and darker purple indicating lower accuracy (closer to 0.0).
### Components/Axes
* **Chart Title:** "Classification accuracies" (top center).
* **Y-Axis (Rows):** Lists twelve dataset names. From top to bottom:
1. `cities_de`
2. `neg_cities_de`
3. `sp_en_trans_de`
4. `neg_sp_en_trans_de`
5. `inventors_de`
6. `neg_inventors_de`
7. `animal_class_de`
8. `neg_animal_class_de`
9. `element_symb_de`
10. `neg_element_symb_de`
11. `facts_de`
12. `neg_facts_de`
* **X-Axis (Columns):** Lists four method abbreviations. From left to right:
1. `TTPD`
2. `LR`
3. `CCS`
4. `MM`
* **Color Scale/Legend:** A vertical bar on the far right of the chart. It maps color to accuracy values from 0.0 (dark purple) to 1.0 (bright yellow). Key markers are at 0.0, 0.2, 0.4, 0.6, 0.8, and 1.0.
* **Data Cells:** Each cell contains a numerical accuracy score formatted as `mean ± standard deviation`. The background color of the cell corresponds to the `mean` value according to the color scale.
### Detailed Analysis
Below is the extracted data for each method across all datasets. Values are presented as `Accuracy ± Standard Deviation`.
**Method: TTPD**
* `cities_de`: 77 ± 2
* `neg_cities_de`: 100 ± 0
* `sp_en_trans_de`: 93 ± 1
* `neg_sp_en_trans_de`: 92 ± 3
* `inventors_de`: 94 ± 0
* `neg_inventors_de`: 97 ± 1
* `animal_class_de`: 82 ± 0
* `neg_animal_class_de`: 92 ± 2
* `element_symb_de`: 88 ± 0
* `neg_element_symb_de`: 81 ± 1
* `facts_de`: 75 ± 2
* `neg_facts_de`: 59 ± 2
**Method: LR**
* `cities_de`: 97 ± 4
* `neg_cities_de`: 100 ± 0
* `sp_en_trans_de`: 72 ± 10
* `neg_sp_en_trans_de`: 96 ± 1
* `inventors_de`: 97 ± 2
* `neg_inventors_de`: 93 ± 5
* `animal_class_de`: 86 ± 3
* `neg_animal_class_de`: 92 ± 5
* `element_symb_de`: 82 ± 7
* `neg_element_symb_de`: 93 ± 4
* `facts_de`: 80 ± 3
* `neg_facts_de`: 79 ± 5
**Method: CCS**
* `cities_de`: 75 ± 20
* `neg_cities_de`: 78 ± 23
* `sp_en_trans_de`: 74 ± 21
* `neg_sp_en_trans_de`: 72 ± 21
* `inventors_de`: 80 ± 23
* `neg_inventors_de`: 80 ± 22
* `animal_class_de`: 71 ± 16
* `neg_animal_class_de`: 79 ± 17
* `element_symb_de`: 67 ± 19
* `neg_element_symb_de`: 69 ± 16
* `facts_de`: 63 ± 10
* `neg_facts_de`: 65 ± 11
**Method: MM**
* `cities_de`: 69 ± 2
* `neg_cities_de`: 100 ± 0
* `sp_en_trans_de`: 93 ± 1
* `neg_sp_en_trans_de`: 91 ± 4
* `inventors_de`: 96 ± 2
* `neg_inventors_de`: 93 ± 3
* `animal_class_de`: 81 ± 1
* `neg_animal_class_de`: 85 ± 2
* `element_symb_de`: 79 ± 4
* `neg_element_symb_de`: 70 ± 2
* `facts_de`: 74 ± 0
* `neg_facts_de`: 59 ± 1
### Key Observations
1. **Perfect Scores:** The `neg_cities_de` dataset achieves a perfect accuracy of 100 ± 0 for three methods (TTPD, LR, MM). The `cities_de` dataset also scores very high (97 ± 4) with LR.
2. **Method Performance Variability:**
* **LR** shows the highest peak performance (multiple scores in the high 90s) but also has notable variability, such as a significant drop on `sp_en_trans_de` (72 ± 10).
* **TTPD** is generally consistent and high-performing, with its lowest score on `neg_facts_de` (59 ± 2).
* **CCS** consistently has the lowest mean accuracy scores across all datasets and exhibits the highest standard deviations (often ±20 or more), indicating very unstable performance.
* **MM** performs strongly on several datasets but shows a sharp decline on `neg_facts_de` (59 ± 1), matching TTPD's low point.
3. **Dataset Difficulty:** The `neg_facts_de` dataset appears to be the most challenging, yielding the lowest scores for three of the four methods (TTPD, CCS, MM). The `facts_de` dataset is also relatively difficult.
4. **Negation Effect:** For many datasets, the "neg_" variant (e.g., `neg_cities_de`) does not necessarily perform worse than its positive counterpart. In some cases, it performs better (e.g., TTPD on `neg_inventors_de` vs. `inventors_de`).
### Interpretation
This heatmap provides a comparative benchmark of four classification methods across a suite of tasks, likely related to natural language processing or knowledge representation given the dataset names (e.g., `cities_de`, `sp_en_trans_de` suggesting German language tasks).
* **What the data suggests:** The LR method appears to be the most capable overall, achieving top or near-top scores on most datasets, though its high variance on one task suggests potential sensitivity. TTPD is a robust and reliable second choice. The CCS method is clearly underperforming and unstable, suggesting it may be unsuitable for these tasks or requires significant tuning. The MM method is competitive but has specific weaknesses.
* **How elements relate:** The color gradient allows for immediate visual comparison. The stark contrast between the bright yellow cells (high accuracy) and the darker orange/purple cells (lower accuracy) quickly draws attention to the best and worst method-dataset pairings. The inclusion of standard deviation is critical, revealing that the poor performance of CCS is not just low but also highly unreliable.
* **Notable anomalies:** The perfect 100% accuracy on `neg_cities_de` for three methods is striking and may indicate that this dataset is trivially easy or that there is a potential issue with data leakage or overfitting for that specific task. The consistently high standard deviations for CCS are a major red flag regarding its robustness. The parallel low scores for TTPD and MM on `neg_facts_de` suggest an inherent difficulty in that dataset that these two methods cannot overcome.