## Heatmap: Classification accuracies
### Overview
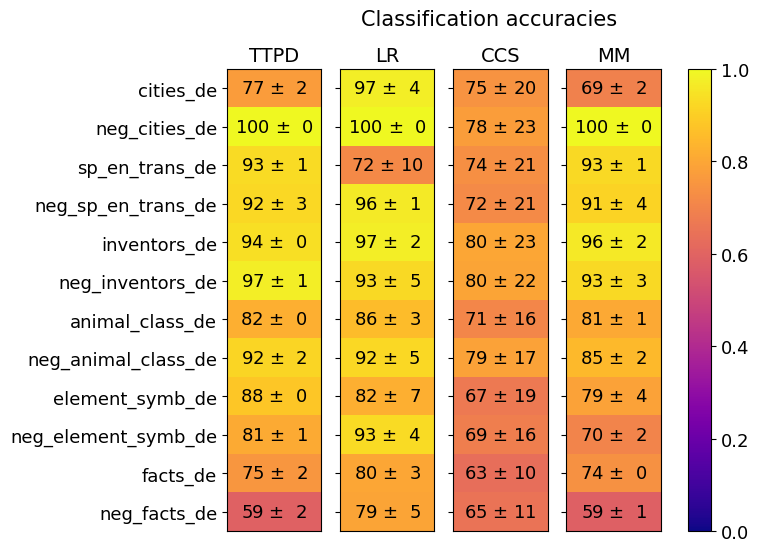
The image is a heatmap visualizing classification accuracy metrics across multiple algorithms and categories. The heatmap uses a color gradient from purple (low accuracy) to yellow (high accuracy), with numerical values and uncertainty ranges (±) embedded in each cell. The data is organized in a matrix format with rows representing categories and columns representing algorithms.
### Components/Axes
- **Title**: "Classification accuracies" (top center)
- **X-axis (Columns)**: Algorithms labeled as:
- TTPD
- LR
- CCS
- MM
- **Y-axis (Rows)**: Categories labeled as:
- cities_de
- neg_cities_de
- sp_en_trans_de
- neg_sp_en_trans_de
- inventors_de
- neg_inventors_de
- animal_class_de
- neg_animal_class_de
- element_symb_de
- neg_element_symb_de
- facts_de
- neg_facts_de
- **Legend**: Right-aligned colorbar with values from 0.0 (purple) to 1.0 (yellow), labeled "Classification accuracies"
- **Color Gradient**: Purple → Red → Orange → Yellow (higher accuracy)
### Detailed Analysis
#### Algorithm Performance
1. **TTPD**:
- cities_de: 77 ± 2 (orange)
- neg_cities_de: 100 ± 0 (yellow)
- sp_en_trans_de: 93 ± 1 (orange)
- neg_sp_en_trans_de: 92 ± 3 (orange)
- inventors_de: 94 ± 0 (orange)
- neg_inventors_de: 97 ± 1 (yellow)
- animal_class_de: 82 ± 0 (orange)
- neg_animal_class_de: 92 ± 2 (orange)
- element_symb_de: 88 ± 0 (orange)
- neg_element_symb_de: 81 ± 1 (orange)
- facts_de: 75 ± 2 (orange)
- neg_facts_de: 59 ± 2 (red)
2. **LR**:
- cities_de: 97 ± 4 (yellow)
- neg_cities_de: 100 ± 0 (yellow)
- sp_en_trans_de: 72 ± 10 (red)
- neg_sp_en_trans_de: 96 ± 1 (yellow)
- inventors_de: 97 ± 2 (yellow)
- neg_inventors_de: 93 ± 5 (orange)
- animal_class_de: 86 ± 3 (orange)
- neg_animal_class_de: 92 ± 5 (orange)
- element_symb_de: 82 ± 7 (orange)
- neg_element_symb_de: 93 ± 4 (yellow)
- facts_de: 80 ± 3 (orange)
- neg_facts_de: 79 ± 5 (orange)
3. **CCS**:
- cities_de: 75 ± 20 (orange)
- neg_cities_de: 78 ± 23 (orange)
- sp_en_trans_de: 74 ± 21 (orange)
- neg_sp_en_trans_de: 72 ± 21 (orange)
- inventors_de: 80 ± 23 (orange)
- neg_inventors_de: 80 ± 22 (orange)
- animal_class_de: 71 ± 16 (orange)
- neg_animal_class_de: 79 ± 17 (orange)
- element_symb_de: 67 ± 19 (red)
- neg_element_symb_de: 69 ± 16 (red)
- facts_de: 63 ± 10 (red)
- neg_facts_de: 65 ± 11 (red)
4. **MM**:
- cities_de: 69 ± 2 (red)
- neg_cities_de: 100 ± 0 (yellow)
- sp_en_trans_de: 93 ± 1 (yellow)
- neg_sp_en_trans_de: 91 ± 4 (orange)
- inventors_de: 96 ± 2 (yellow)
- neg_inventors_de: 93 ± 3 (yellow)
- animal_class_de: 81 ± 1 (orange)
- neg_animal_class_de: 85 ± 2 (orange)
- element_symb_de: 79 ± 4 (orange)
- neg_element_symb_de: 70 ± 2 (red)
- facts_de: 74 ± 0 (orange)
- neg_facts_de: 59 ± 1 (red)
### Key Observations
1. **Highest Accuracy**:
- LR and MM achieve 100% accuracy in neg_cities_de.
- LR and MM also show 97-100% accuracy in inventors_de and neg_inventors_de.
2. **Lowest Accuracy**:
- CCS struggles with neg_facts_de (65 ± 11) and element_symb_de (67 ± 19).
- TTPD and MM have the lowest accuracy in neg_facts_de (59 ± 2 and 59 ± 1, respectively).
3. **Algorithm-Specific Trends**:
- **LR**: Consistently high performance in neg_cities_de (100%) and inventors_de (97%).
- **CCS**: Lower accuracy across most categories, with significant uncertainty (±10-23).
- **MM**: Strong performance in neg_cities_de (100%) and inventors_de (96%), but weaker in neg_facts_de (59%).
4. **Category-Specific Trends**:
- **neg_ categories**: Generally lower accuracy (e.g., neg_facts_de: 59-79%).
- **de categories**: Higher accuracy in cities_de (77-97%) and inventors_de (94-97%).
### Interpretation
The heatmap reveals that **LR and MM algorithms outperform TTPD and CCS** in most categories, particularly in neg_cities_de and inventors_de. The **neg_ categories** (e.g., neg_facts_de, neg_element_symb_de) consistently show lower accuracy, suggesting these may represent more challenging or underrepresented data. The **CCS algorithm** exhibits the highest variability (e.g., ±20 in cities_de), indicating potential instability in its performance. The **LR algorithm** demonstrates the most consistent high accuracy (93-100%) across categories, while **MM** balances strong performance in key areas with moderate results in others. The color gradient confirms that yellow cells (high accuracy) dominate for LR and MM, whereas red/orange cells (lower accuracy) are more prevalent for CCS and TTPD in neg_ categories.