## Line Chart: Critic Score Mean vs. Step
### Overview
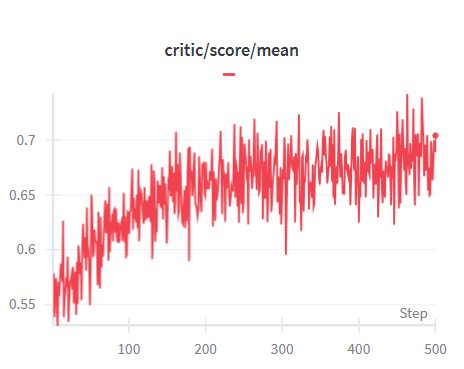
The image is a line chart showing the trend of the "critic/score/mean" over a series of steps. The x-axis represents the "Step" number, ranging from 0 to 500. The y-axis represents the "critic/score/mean" value, ranging from 0.55 to 0.7. The line, colored red, shows an upward trend initially, then fluctuates around a relatively stable value.
### Components/Axes
* **Title:** critic/score/mean
* **X-axis:**
* Label: Step
* Scale: 0 to 500, with markers at 100, 200, 300, 400, and 500.
* **Y-axis:**
* Scale: 0.55 to 0.7, with markers at 0.55, 0.6, 0.65, and 0.7.
* **Legend:** A short red line next to the title "critic/score/mean" indicates the color of the data series.
### Detailed Analysis
* **Data Series:** critic/score/mean (red line)
* **Trend:** The line starts at approximately 0.54 at Step 0. It increases relatively rapidly until approximately Step 100, reaching a value of approximately 0.63. From Step 100 to Step 500, the line fluctuates, but generally remains between 0.63 and 0.7. The final value at Step 500 is approximately 0.7.
### Key Observations
* The critic score mean increases significantly in the first 100 steps.
* After 100 steps, the score fluctuates but does not show a strong upward or downward trend.
* The score appears to stabilize around 0.65 after the initial increase.
### Interpretation
The chart suggests that the critic's score improves significantly during the initial steps of the process, indicating a learning phase. After this initial learning phase, the critic's score stabilizes, suggesting that the critic has reached a certain level of performance and is no longer improving significantly with each step. The fluctuations after the initial learning phase could be due to various factors, such as the inherent variability in the data or the critic's exploration of different strategies. The fact that the score does not decrease significantly suggests that the critic is not forgetting what it has learned.