\n
## Line Chart: Critic Score Mean Over Steps
### Overview
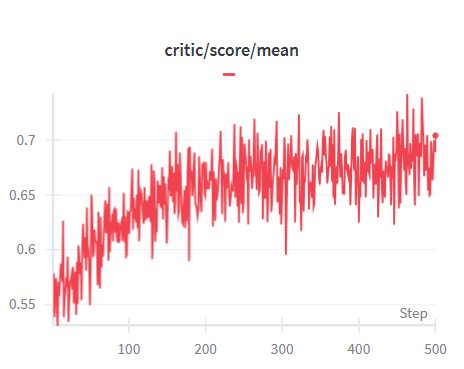
The image displays a line chart illustrating the trend of the mean critic score over a series of steps. The chart shows a generally increasing trend with significant fluctuations.
### Components/Axes
* **Title:** "critic/score/mean" positioned at the top-center of the chart. A horizontal line is present below the title.
* **X-axis:** Labeled "Step" at the bottom-right. The scale ranges from approximately 0 to 500, with tick marks at intervals of 100.
* **Y-axis:** The left side of the chart represents the Y-axis, with a scale ranging from approximately 0.55 to 0.72, with tick marks at intervals of 0.05.
* **Data Series:** A single red line representing the "critic/score/mean".
* **Legend:** There is no explicit legend, but the line color (red) is associated with the title "critic/score/mean".
### Detailed Analysis
The red line representing the critic score mean starts at approximately 0.55 at Step 0 and generally increases, reaching a peak of approximately 0.72 around Step 450. The line exhibits substantial volatility throughout the entire range.
Here's a breakdown of approximate values at specific steps:
* Step 50: Approximately 0.58
* Step 100: Approximately 0.62
* Step 150: Approximately 0.65
* Step 200: Approximately 0.67
* Step 250: Approximately 0.68
* Step 300: Approximately 0.69
* Step 350: Approximately 0.70
* Step 400: Approximately 0.70
* Step 450: Approximately 0.72
* Step 500: Approximately 0.68
The trend is generally upward, but with frequent and significant dips and peaks. The line appears to plateau between steps 350 and 400 before a final increase and subsequent decrease.
### Key Observations
* The critic score mean demonstrates a clear upward trend over the 500 steps.
* The volatility is high, indicating substantial fluctuations in the critic score.
* There is a period of relative stability between steps 350 and 400.
* The final value at Step 500 is lower than the peak at Step 450, suggesting a recent decline.
### Interpretation
The chart suggests that the critic score, on average, improves over time (as measured by "Step"). However, the large fluctuations indicate that individual critic scores vary considerably. The plateau around steps 350-400 could represent a period of consolidation or diminishing returns in score improvement. The final dip at Step 500 might indicate a recent negative event or change in the evaluated subject. The "Step" variable is not defined, but it likely represents a progression of some kind – perhaps iterations of a process, time intervals, or stages of development. The data suggests a learning curve or improvement process, but one that is not smooth or predictable. The high volatility could be due to inherent subjectivity in critic evaluations, external factors influencing scores, or the nature of the subject being evaluated.