## Line Graph: critic/score/mean
### Overview
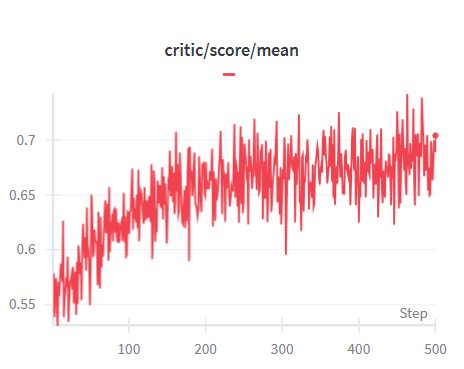
The image depicts a line graph titled "critic/score/mean" with a red line representing data points across a horizontal axis labeled "Step" (ranging from 100 to 500) and a vertical axis labeled "critic/score/mean" (ranging from 0.55 to 0.75). The line exhibits fluctuations but shows an overall upward trend, ending at approximately 0.705 at Step 500.
### Components/Axes
- **Title**: "critic/score/mean" (centered at the top).
- **X-Axis (Horizontal)**:
- Label: "Step" (bottom-right).
- Scale: Incremented by 100, with markers at 100, 200, 300, 400, and 500.
- **Y-Axis (Vertical)**:
- Label: "critic/score/mean" (left-aligned).
- Scale: Incremented by 0.05, with markers at 0.55, 0.60, 0.65, 0.70, and 0.75.
- **Legend**:
- Position: Top-center.
- Content: "critic/score/mean" (red line).
- **Gridlines**: Faint gray lines span both axes for reference.
### Detailed Analysis
- **Data Series**:
- A single red line represents the "critic/score/mean" metric.
- The line starts near 0.55 at Step 100, rises to ~0.65 by Step 200, and fluctuates between ~0.65 and ~0.70 until Step 500, where it peaks at ~0.705.
- Notable spikes and dips occur throughout, with the largest drop near Step 300 (temporarily dipping below 0.65) and a sharp rise afterward.
### Key Observations
1. **Upward Trend**: The metric increases overall from Step 100 to Step 500, with a net gain of ~0.155.
2. **Volatility**: Significant fluctuations (e.g., Step 250–350) suggest variability in the measured data.
3. **Final Peak**: The highest value (~0.705) occurs at Step 500, exceeding the y-axis maximum of 0.70.
### Interpretation
The graph likely tracks a performance metric (e.g., critic scores, mean evaluations) over sequential steps (e.g., iterations, time intervals). The upward trend implies improvement or stabilization over time, while fluctuations may reflect external factors, measurement noise, or inherent variability in the system. The final peak at Step 500 could indicate a critical threshold, optimization milestone, or saturation point. The absence of additional context (e.g., labels for "Step") limits precise interpretation, but the data suggests a positive correlation between "Step" and "critic/score/mean."