## Diagram: LLM Logit Combination
### Overview
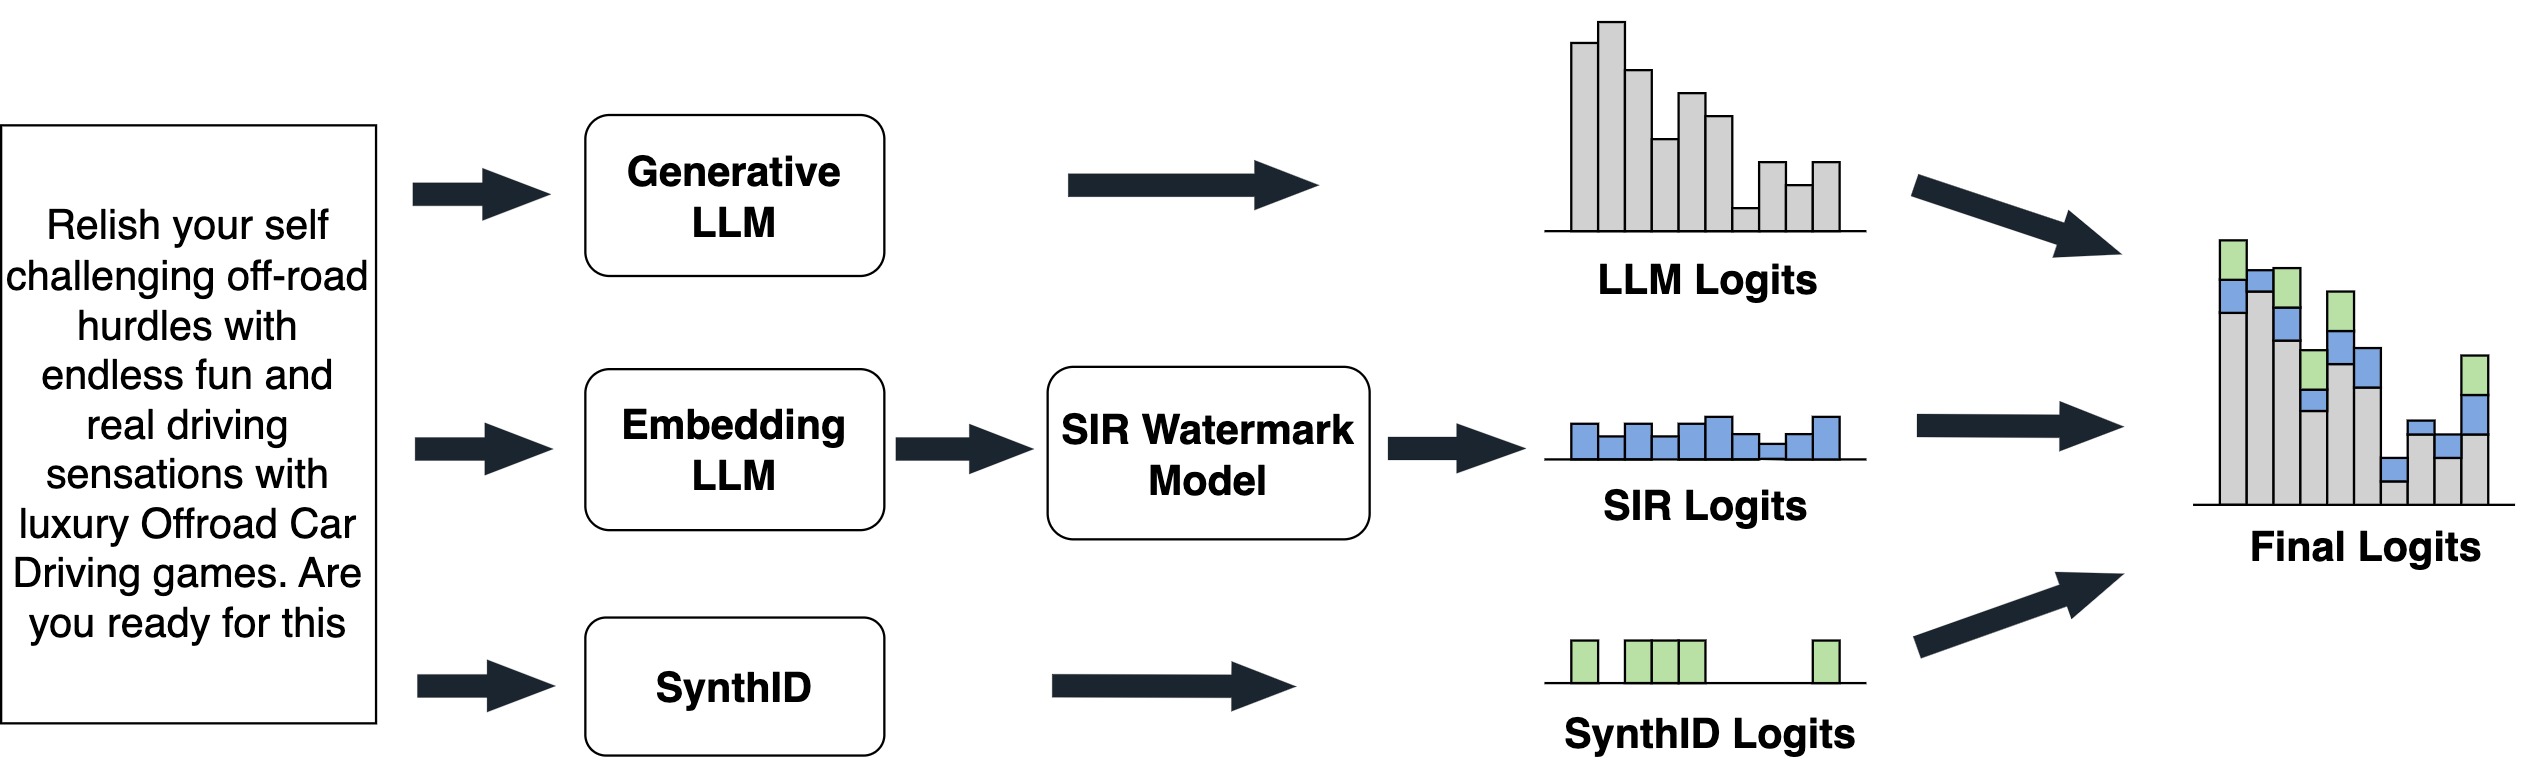
The image is a diagram illustrating a process where the outputs (logits) of multiple language models (LLMs) and a watermark model are combined to produce final logits. The diagram shows three parallel paths, each starting with a different model (Generative LLM, Embedding LLM, and SynthID), and converging at the end to produce "Final Logits".
### Components/Axes
* **Text Box (Left):** Contains the text "Relish your self challenging off-road hurdles with endless fun and real driving sensations with luxury Offroad Car Driving games. Are you ready for this".
* **Generative LLM:** A rectangular box labeled "Generative LLM".
* **Embedding LLM:** A rectangular box labeled "Embedding LLM".
* **SynthID:** A rectangular box labeled "SynthID".
* **SIR Watermark Model:** A rectangular box labeled "SIR Watermark Model". This box is only in the path of the Embedding LLM.
* **LLM Logits:** A bar graph labeled "LLM Logits". The bars are gray.
* **SIR Logits:** A bar graph labeled "SIR Logits". The bars are light blue.
* **SynthID Logits:** A bar graph labeled "SynthID Logits". The bars are light green.
* **Final Logits:** A stacked bar graph labeled "Final Logits". The bars are composed of gray, light blue, and light green segments.
* **Arrows:** Black arrows indicate the flow of information from left to right.
### Detailed Analysis or ### Content Details
1. **Input Text:** The text box on the left contains a promotional message, likely for a car driving game.
2. **Generative LLM Path:**
* The "Generative LLM" block outputs "LLM Logits", represented by a gray bar graph. The bars in the graph show a decreasing trend from left to right. The approximate heights of the bars are: 10, 9, 8, 7, 6, 4, 3, 4.
3. **Embedding LLM Path:**
* The "Embedding LLM" block feeds into the "SIR Watermark Model".
* The "SIR Watermark Model" outputs "SIR Logits", represented by a light blue bar graph. The bars in the graph are relatively uniform in height. The approximate heights of the bars are: 2, 2, 2, 2, 2, 2, 2, 2.
4. **SynthID Path:**
* The "SynthID" block outputs "SynthID Logits", represented by a light green bar graph. The bars are sparse and have low values. The approximate heights of the bars are: 1, 0, 1, 0, 0, 0, 1, 0.
5. **Final Logits:**
* The "Final Logits" graph combines the outputs of the three paths. The gray bars from "LLM Logits" form the base of the stacked bars. The light blue bars from "SIR Logits" are stacked on top of the gray bars, and the light green bars from "SynthID Logits" are stacked on top of the light blue bars. The approximate heights of the final stacked bars are: 13, 12, 11, 9, 8, 6, 6, 4.
### Key Observations
* The Generative LLM contributes the most significant component to the final logits, as indicated by the height of the gray bars.
* The SIR Watermark Model adds a relatively consistent amount to the logits, as indicated by the uniform height of the light blue bars.
* The SynthID contributes the least to the final logits, as indicated by the sparse and low values of the light green bars.
### Interpretation
The diagram illustrates a system where multiple models contribute to the final output logits. The Generative LLM provides the primary content, while the Embedding LLM and SIR Watermark Model add a layer of security or identification through watermarking. The SynthID likely adds a further layer of identification or authentication. The combination of these models aims to produce a more robust and secure output. The relative contributions of each model can be inferred from the heights of the bars in the "Final Logits" graph. The system appears to prioritize the output of the Generative LLM, with the other models providing supplementary information.