## Diagram: Technical Process Flow with RoPE, FreqFold, and BKV-PCA Components
### Overview
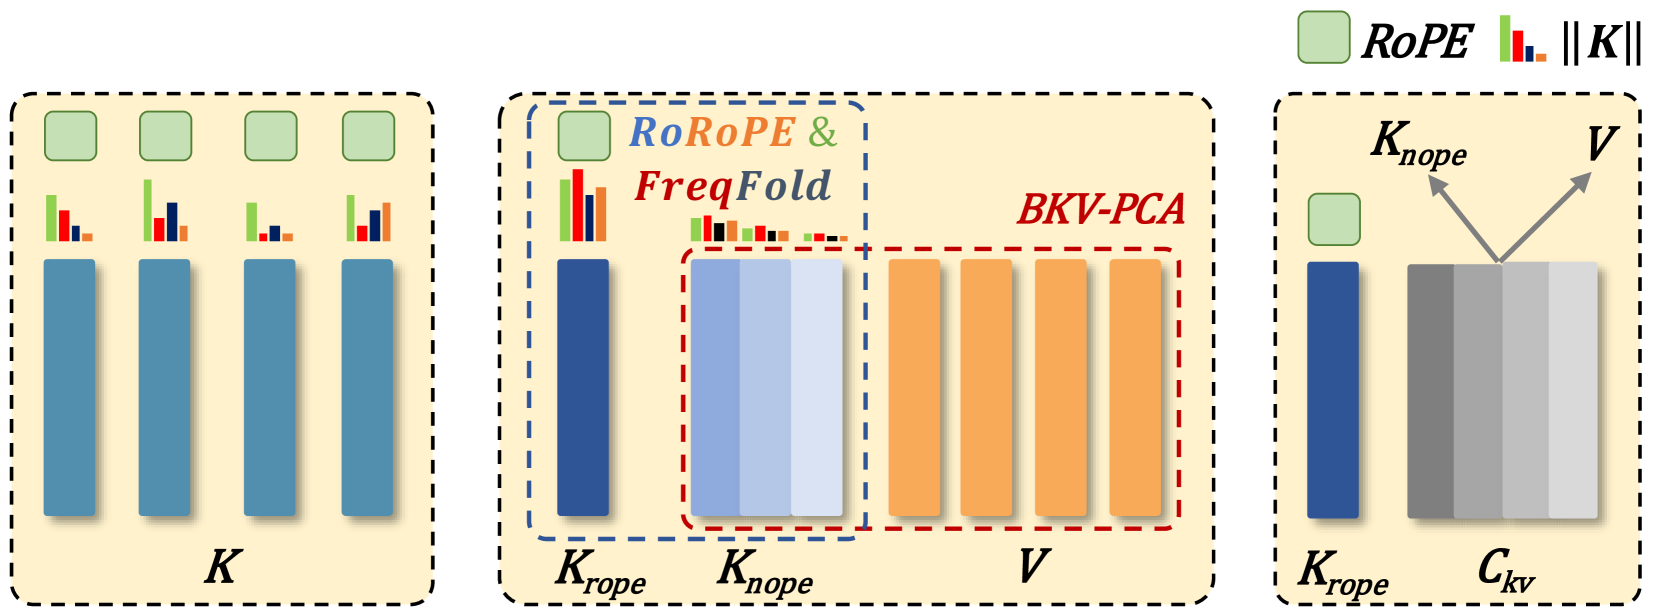
The diagram illustrates a three-stage technical process involving matrix operations and dimensionality reduction techniques. It uses color-coded bars and labeled components to represent relationships between variables (K, V, C_kv) and methods (RoPE, FreqFold, BKV-PCA). The flow progresses from raw input (K) through processing stages to final output (C_kv).
### Components/Axes
1. **Panels**:
- **Left Panel (K)**: Four blue bars labeled "K" with decreasing heights.
- **Center Panel (RoPE & FreqFold)**:
- Blue bar labeled "K_rope"
- Red-dashed box containing:
- Blue bar labeled "K_nope"
- Orange bars labeled "V"
- **Right Panel (K_nope V)**:
- Blue bar labeled "K_nope"
- Gray gradient bar labeled "C_kv"
2. **Legends**:
- **Top Right**:
- Green square labeled "RoPE"
- Bar chart with:
- Red bar labeled "K"
- Blue bar labeled "K"
- Orange bar labeled "K"
- Green bar labeled "K"
- **Center Panel**:
- Blue dashed box labeled "RoPE & FreqFold"
- Red dashed box labeled "BKV-PCA"
3. **Arrows**:
- Gray arrows from "K_nope" to "C_kv" in the right panel.
### Detailed Analysis
1. **Left Panel (K)**:
- Four blue bars represent decreasing magnitudes of variable K.
- No explicit numerical values provided; relative heights suggest ordered values (e.g., K₁ > K₂ > K₃ > K₄).
2. **Center Panel (RoPE & FreqFold)**:
- **K_rope**: Single blue bar taller than K_nope, indicating higher magnitude.
- **K_nope**: Blue bar under red-dashed box, shorter than K_rope.
- **V**: Three orange bars of varying heights, possibly representing transformed values from K_nope.
- **BKV-PCA**: Red-dashed box encloses K_nope and V, suggesting a combined processing step.
3. **Right Panel (K_nope V)**:
- **K_nope**: Blue bar matches the center panel's K_nope.
- **C_kv**: Gray gradient bar with four segments, likely a composite of K_nope and V processed via BKV-PCA.
- Arrows imply a direct relationship between K_nope and C_kv.
### Key Observations
- **Color Consistency**: Blue consistently represents K/K_nope across panels. Orange represents V, and gray represents C_kv.
- **Dimensionality Reduction**: The transition from discrete bars (K, V) to a gradient bar (C_kv) suggests a dimensionality reduction or feature extraction process.
- **Method Differentiation**: RoPE and FreqFold are grouped in the center panel, while BKV-PCA is isolated in the right panel, indicating sequential processing stages.
### Interpretation
This diagram likely represents a machine learning or signal processing pipeline:
1. **Input Stage (K)**: Raw data (K) is processed through RoPE and FreqFold methods.
2. **Intermediate Processing (K_rope/K_nope, V)**: RoPE distinguishes between K_rope (retained) and K_nope (discarded), while FreqFold transforms K_nope into V.
3. **Final Output (C_kv)**: BKV-PCA combines K_nope and V into a compressed representation (C_kv), with the gradient bar indicating a continuous or multi-dimensional output.
The use of dashed boxes and arrows emphasizes hierarchical relationships between components, with RoPE acting as a filtering mechanism and BKV-PCA as a dimensionality reduction technique. The absence of numerical values suggests the diagram focuses on conceptual relationships rather than quantitative results.