## Scatter Plot: Law School Admissions
### Overview
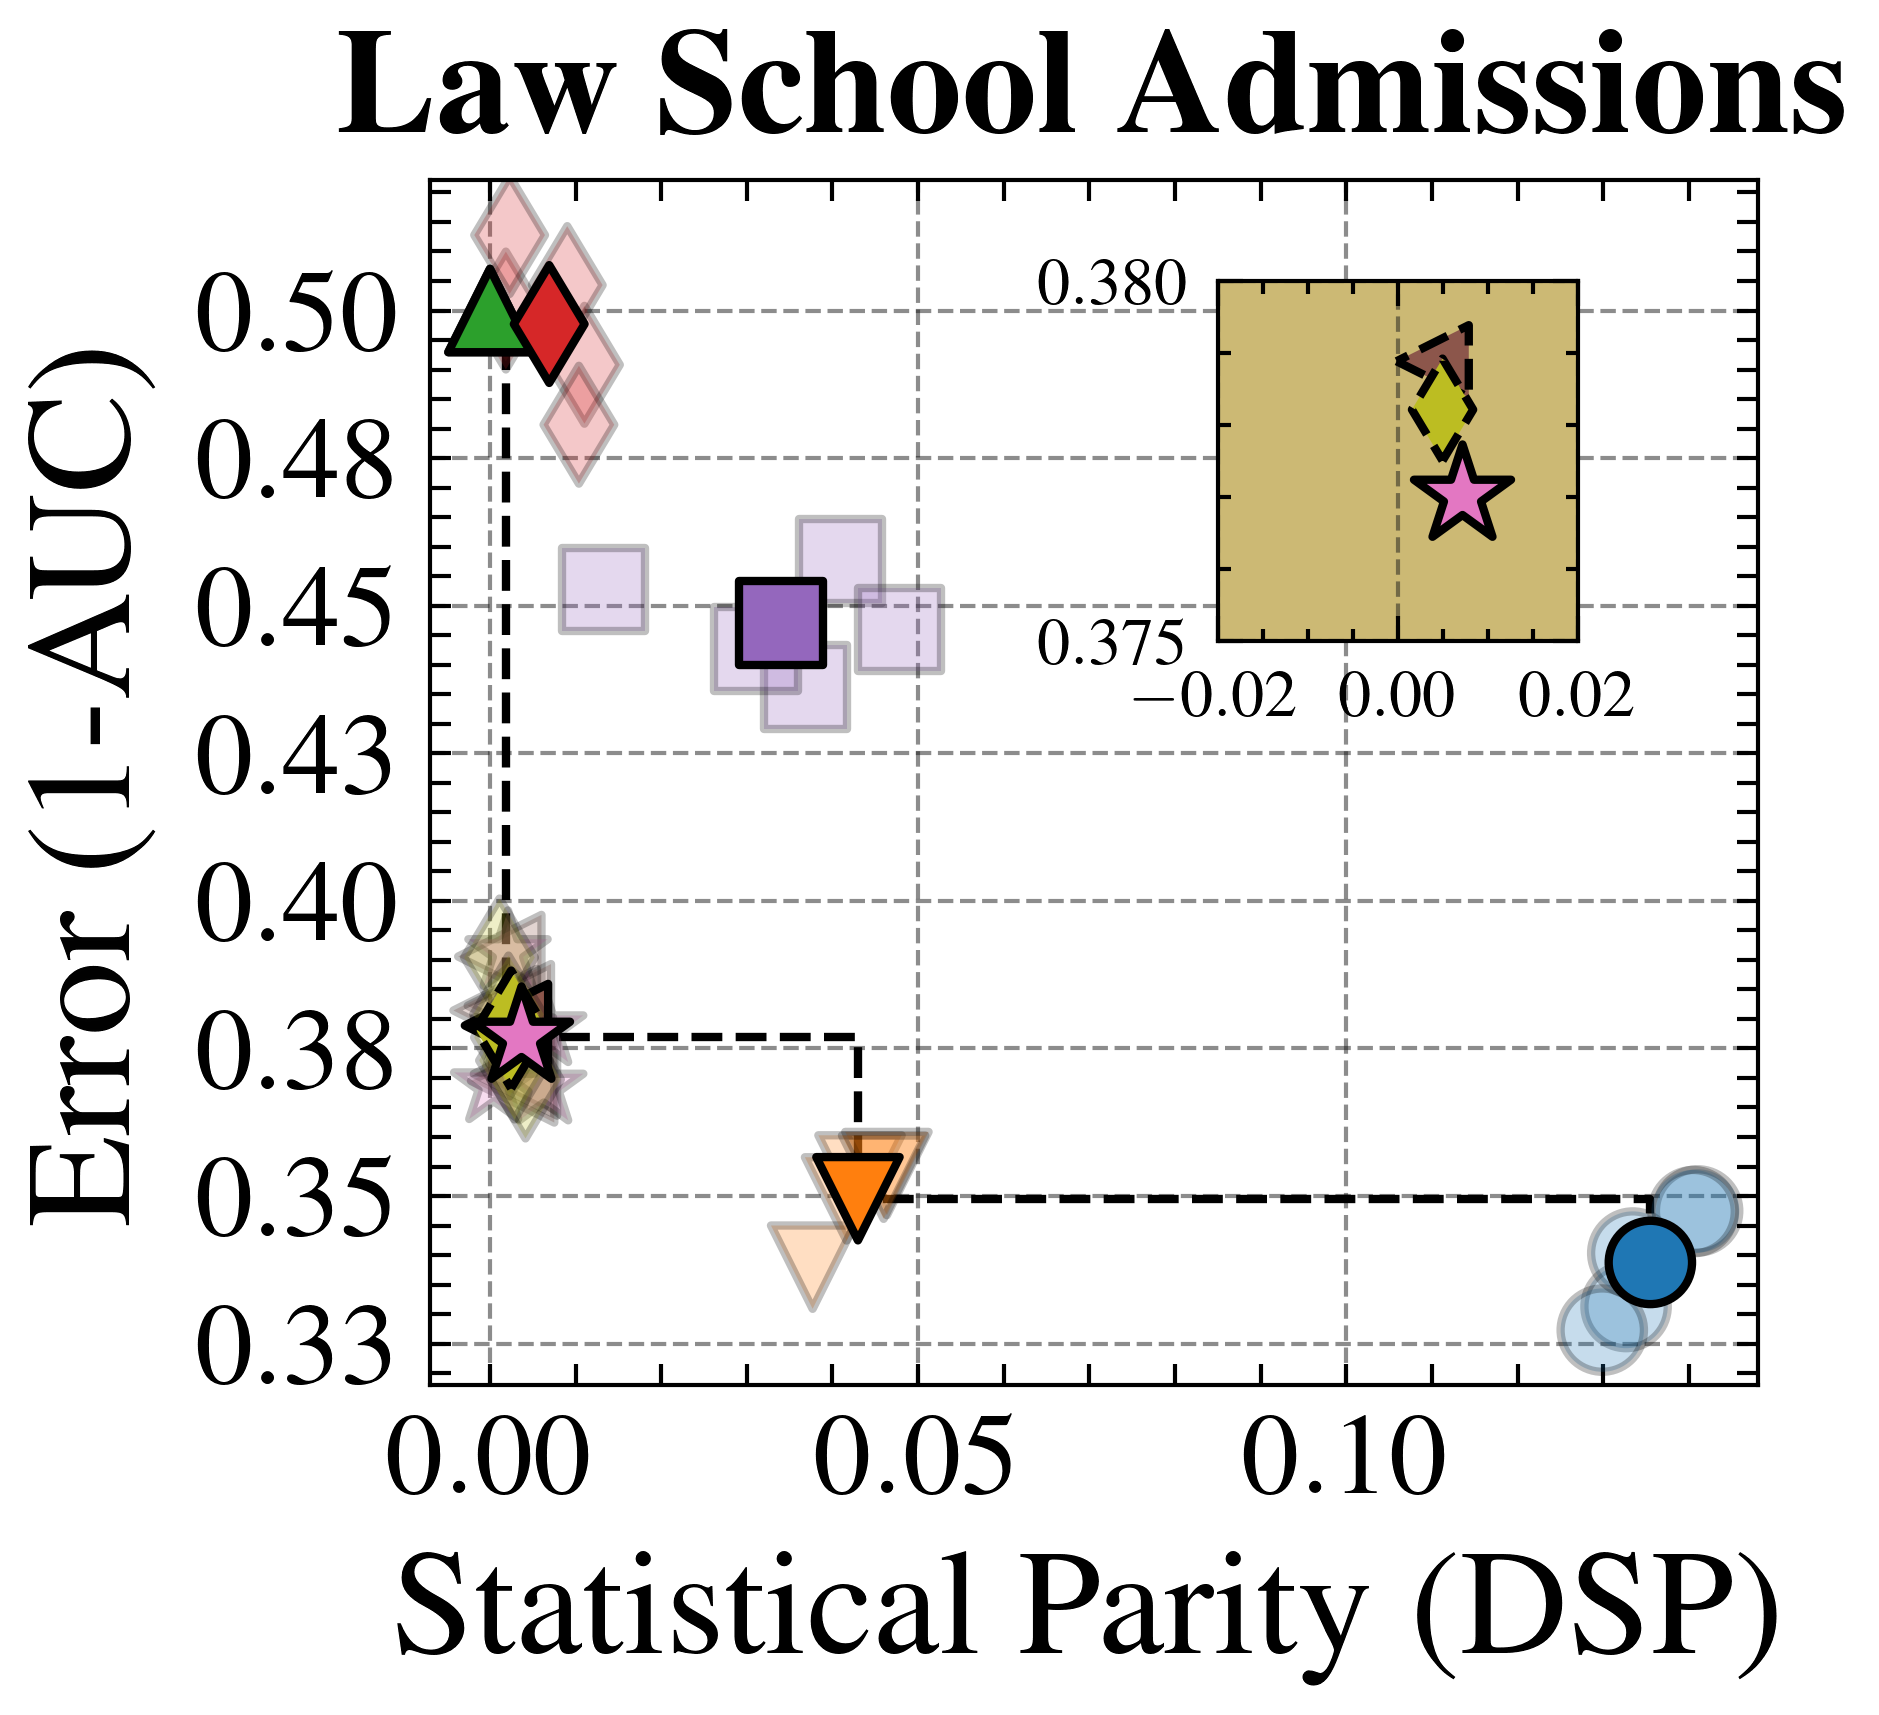
The image is a scatter plot titled "Law School Admissions" comparing **Error (1-AUC)** on the y-axis (ranging from 0.33 to 0.50) and **Statistical Parity (DSP)** on the x-axis (ranging from 0.00 to 0.10). The plot includes multiple colored markers (triangles, diamonds, squares, stars, circles) representing distinct data points or groups. A beige inset box in the top-right corner highlights a subset of data with annotations.
---
### Components/Axes
- **Y-Axis (Error (1-AUC))**: Labeled with values from 0.33 to 0.50 in increments of 0.01. A dashed horizontal line at **0.38** spans the plot.
- **X-Axis (Statistical Parity (DSP))**: Labeled with values from 0.00 to 0.10 in increments of 0.01. A dashed vertical line at **0.05** spans the plot.
- **Legend**: Not explicitly visible in the image, but markers are color-coded (e.g., green triangles, red diamonds, purple squares, etc.).
- **Inset Box**: A beige-highlighted region in the top-right corner (x: 0.00–0.02, y: 0.375–0.380) with additional annotations (**0.380**, **−0.02**).
---
### Detailed Analysis
#### Data Points
1. **Top-Left Cluster** (x: 0.00–0.02, y: 0.48–0.50):
- Green triangle at (0.00, 0.50).
- Red diamond at (0.00, 0.48).
- Pink diamond at (0.01, 0.49).
- Light pink diamond at (0.01, 0.47).
2. **Center-Left Cluster** (x: 0.03–0.05, y: 0.43–0.45):
- Purple square at (0.04, 0.44).
- Light purple square at (0.03, 0.43).
- Dark purple square at (0.05, 0.45).
3. **Bottom-Left Cluster** (x: 0.00–0.05, y: 0.38–0.40):
- Pink star at (0.00, 0.38).
- Light pink star at (0.01, 0.39).
- Orange triangle at (0.04, 0.37).
4. **Right Cluster** (x: 0.08–0.10, y: 0.33–0.35):
- Blue circles at (0.08, 0.34), (0.09, 0.33), and (0.10, 0.35).
5. **Inset Box** (x: 0.00–0.02, y: 0.375–0.380):
- Pink star at (0.01, 0.38).
- Yellow diamond at (0.015, 0.375).
- Brown triangle at (0.02, 0.38).
- Annotation: **0.380** (top-left) and **−0.02** (bottom-left).
---
### Key Observations
1. **High Error, Low DSP**: The top-left cluster (e.g., green triangle, red diamond) shows the highest error (1-AUC) values (0.48–0.50) with near-zero DSP.
2. **Moderate Error, Moderate DSP**: The center-left cluster (purple squares) has mid-range error (0.43–0.45) and DSP (0.03–0.05).
3. **Low Error, High DSP**: The right cluster (blue circles) exhibits the lowest error (0.33–0.35) and highest DSP (0.08–0.10).
4. **Inset Focus**: The beige box highlights a narrow range of DSP (0.00–0.02) and error (0.375–0.380), with mixed markers (star, diamond, triangle).
---
### Interpretation
- **Statistical Parity vs. Error Tradeoff**: Higher DSP (x-axis) correlates with lower error (y-axis), suggesting that law schools with greater statistical parity (fairness) achieve better predictive accuracy (lower 1-AUC error).
- **Outliers**: The top-left cluster (high error, low DSP) may represent admissions processes with significant bias or inefficiency.
- **Inset Significance**: The beige box isolates a critical region where small changes in DSP (0.00–0.02) correspond to minimal error variation (0.375–0.380), possibly indicating a threshold for acceptable fairness-accuracy balance.
- **Color/Shape Encoding**: The use of distinct markers (triangles, diamonds, etc.) likely represents different admission criteria or demographic groups, though the legend is missing for confirmation.
---
### Technical Notes
- **Missing Legend**: The legend’s labels (e.g., what each color/shape represents) are not visible, limiting interpretability.
- **Dashed Lines**: The 0.38 (error) and 0.05 (DSP) lines may denote benchmarks for acceptable error rates or fairness thresholds.
- **Inset Annotations**: The **−0.02** value in the inset box could indicate a negative adjustment or offset in the analysis.
This plot underscores the tension between fairness (DSP) and accuracy (1-AUC) in law school admissions, with data suggesting that optimizing for statistical parity improves predictive performance.