## Chart: Energy vs. Number of Points and Ratio vs. Number of Points
### Overview
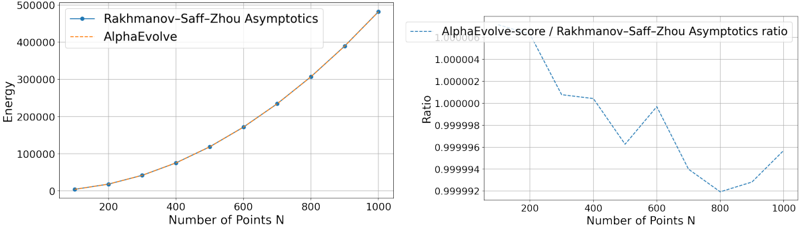
The image presents two line charts side-by-side. The left chart displays the relationship between "Energy" and "Number of Points N" for two methods: "Rakhmanov-Saff-Zhou Asymptotics" and "AlphaEvolve." The right chart shows the ratio of "AlphaEvolve-score" to "Rakhmanov-Saff-Zhou Asymptotics" against the "Number of Points N."
### Components/Axes
**Left Chart:**
* **Title:** Implicitly, Energy vs. Number of Points
* **X-axis:** "Number of Points N" with scale from 0 to 1000, increments of 200.
* **Y-axis:** "Energy" with scale from 0 to 500000, increments of 100000.
* **Legend (Top-Left):**
* Blue line with circles: "Rakhmanov-Saff-Zhou Asymptotics"
* Orange dashed line: "AlphaEvolve"
**Right Chart:**
* **Title:** Implicitly, Ratio vs. Number of Points
* **X-axis:** "Number of Points N" with scale from 200 to 1000, increments of 200.
* **Y-axis:** "Ratio" with scale from 0.999992 to 1.000004, increments are not uniform.
* **Legend (Top-Left):**
* Dashed blue line: "AlphaEvolve-score / Rakhmanov-Saff-Zhou Asymptotics ratio"
### Detailed Analysis
**Left Chart: Energy vs. Number of Points**
* **Rakhmanov-Saff-Zhou Asymptotics (Blue Line):** The energy increases non-linearly with the number of points.
* N = 100, Energy ≈ 10000
* N = 200, Energy ≈ 20000
* N = 300, Energy ≈ 40000
* N = 400, Energy ≈ 75000
* N = 500, Energy ≈ 120000
* N = 600, Energy ≈ 175000
* N = 700, Energy ≈ 240000
* N = 800, Energy ≈ 310000
* N = 900, Energy ≈ 390000
* N = 1000, Energy ≈ 480000
* **AlphaEvolve (Orange Dashed Line):** The energy increases non-linearly with the number of points, closely following the "Rakhmanov-Saff-Zhou Asymptotics" line.
* The values are very close to the blue line, so the approximate values are the same as above.
**Right Chart: Ratio vs. Number of Points**
* **AlphaEvolve-score / Rakhmanov-Saff-Zhou Asymptotics ratio (Dashed Blue Line):** The ratio fluctuates and generally decreases as the number of points increases.
* N = 200, Ratio ≈ 1.000004
* N = 300, Ratio ≈ 1.000001
* N = 400, Ratio ≈ 1.000000
* N = 500, Ratio ≈ 0.999997
* N = 600, Ratio ≈ 1.000000
* N = 700, Ratio ≈ 0.999993
* N = 800, Ratio ≈ 0.999992
* N = 900, Ratio ≈ 0.999993
* N = 1000, Ratio ≈ 0.999994
### Key Observations
* The energy values for both "Rakhmanov-Saff-Zhou Asymptotics" and "AlphaEvolve" increase significantly as the number of points increases, showing a non-linear relationship.
* The "AlphaEvolve-score / Rakhmanov-Saff-Zhou Asymptotics ratio" fluctuates around 1, indicating that the "AlphaEvolve-score" is generally close to the "Rakhmanov-Saff-Zhou Asymptotics" value.
* The ratio shows a slight decreasing trend as the number of points increases, suggesting that "AlphaEvolve-score" might be slightly lower than "Rakhmanov-Saff-Zhou Asymptotics" at higher point numbers.
### Interpretation
The charts compare the energy values obtained from two different methods, "Rakhmanov-Saff-Zhou Asymptotics" and "AlphaEvolve," as the number of points increases. The left chart demonstrates that both methods yield similar energy values, which increase non-linearly with the number of points. The right chart provides a more granular comparison by showing the ratio of "AlphaEvolve-score" to "Rakhmanov-Saff-Zhou Asymptotics." The ratio fluctuates around 1, indicating that the two methods produce comparable results. However, the slight decreasing trend in the ratio suggests that "AlphaEvolve-score" might be marginally lower than "Rakhmanov-Saff-Zhou Asymptotics" as the number of points increases. This could imply that "Rakhmanov-Saff-Zhou Asymptotics" is slightly more efficient or accurate at higher point numbers, although the difference is very small.