## Line Charts: Energy vs. Number of Points and Ratio Analysis
### Overview
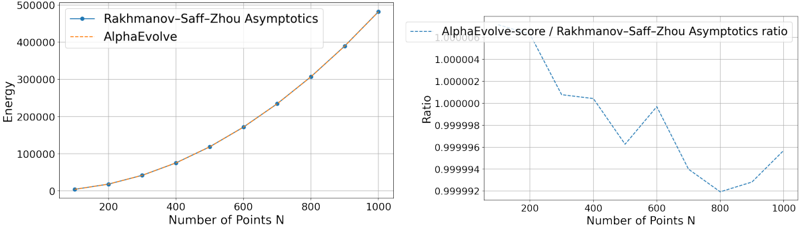
The image contains two side-by-side line charts. The left chart compares the "Energy" values of two methods ("Rakhmanov-Saff-Zhou Asymptotics" and "AlphaEvolve") as a function of the "Number of Points N". The right chart plots the ratio of the "AlphaEvolve-score" to the "Rakhmanov-Saff-Zhou Asymptotics" value against the same "Number of Points N".
### Components/Axes
**Left Chart:**
* **X-axis:** Label: "Number of Points N". Scale: Linear, with major tick marks at 200, 400, 600, 800, 1000.
* **Y-axis:** Label: "Energy". Scale: Linear, with major tick marks at 0, 100000, 200000, 300000, 400000, 500000.
* **Legend:** Positioned in the top-left corner.
* Blue solid line with circular markers: "Rakhmanov-Saff-Zhou Asymptotics"
* Orange dashed line: "AlphaEvolve"
**Right Chart:**
* **X-axis:** Label: "Number of Points N". Scale: Linear, with major tick marks at 200, 400, 600, 800, 1000.
* **Y-axis:** Label: "Ratio". Scale: Linear, with major tick marks at 0.999992, 0.999994, 0.999996, 0.999998, 1.000000, 1.000002, 1.000004.
* **Legend:** Positioned in the top-left corner.
* Blue dashed line: "AlphaEvolve-score / Rakhmanov-Saff-Zhou Asymptotics ratio"
### Detailed Analysis
**Left Chart - Energy Comparison:**
* **Trend Verification:** Both data series show a clear, smooth, upward-curving (likely quadratic or exponential) trend. The "Rakhmanov-Saff-Zhou Asymptotics" line (blue, solid) is consistently positioned slightly above the "AlphaEvolve" line (orange, dashed) across the entire range of N.
* **Data Points (Approximate Values):**
* **N=200:** Rakhmanov-Saff-Zhou Asymptotics ≈ 10,000; AlphaEvolve ≈ 8,000
* **N=400:** Rakhmanov-Saff-Zhou Asymptotics ≈ 70,000; AlphaEvolve ≈ 65,000
* **N=600:** Rakhmanov-Saff-Zhou Asymptotics ≈ 170,000; AlphaEvolve ≈ 165,000
* **N=800:** Rakhmanov-Saff-Zhou Asymptotics ≈ 310,000; AlphaEvolve ≈ 305,000
* **N=1000:** Rakhmanov-Saff-Zhou Asymptotics ≈ 480,000; AlphaEvolve ≈ 475,000
**Right Chart - Ratio Analysis:**
* **Trend Verification:** The ratio line (blue, dashed) shows an overall downward trend with notable fluctuations. It starts above 1.000004, decreases to a local minimum near N=500, rises to a local peak at N=600, then falls to its global minimum near N=800 before rising again.
* **Data Points (Approximate Values):**
* **N=200:** Ratio ≈ 1.0000045
* **N=400:** Ratio ≈ 1.0000005
* **N=500:** Ratio ≈ 0.9999965 (local minimum)
* **N=600:** Ratio ≈ 0.9999995 (local peak)
* **N=800:** Ratio ≈ 0.9999920 (global minimum)
* **N=1000:** Ratio ≈ 0.9999960
### Key Observations
1. **Strong Correlation:** The two energy curves in the left chart are extremely close, indicating a very strong correlation between the "AlphaEvolve" method and the "Rakhmanov-Saff-Zhou Asymptotics" benchmark.
2. **Ratio Proximity to Unity:** The ratio in the right chart is exceptionally close to 1.0, varying only in the fifth and sixth decimal places (between ~0.999992 and ~1.0000045). This confirms the high degree of agreement between the two methods.
3. **Non-Monotonic Ratio:** The ratio does not decrease smoothly. The local peak at N=600 and the subsequent dip to a minimum at N=800 suggest the relationship between the two methods has subtle, non-linear characteristics as N increases.
4. **Visual Precision:** The use of markers on the left chart's blue line but not on the orange line or the right chart's line is a deliberate visual distinction.
### Interpretation
The data demonstrates that the "AlphaEvolve" method produces energy estimates that are in excellent agreement with the established "Rakhmanov-Saff-Zhou Asymptotics" across a range of point counts (N=200 to 1000). The left chart shows both methods scale similarly with N, while the right chart quantifies their relative difference with high precision.
The fact that the ratio is not constant and dips below 1.0 (meaning AlphaEvolve's score is slightly *lower* than the asymptotic value at certain N, like N=800) is a key finding. It suggests the AlphaEvolve algorithm may have a slight, N-dependent bias or that it captures a subtle correction term not fully accounted for in the pure asymptotic formula. The fluctuations in the ratio could be due to numerical precision effects, the specific geometry of point configurations at those N values, or an intrinsic property of the AlphaEvolve algorithm's convergence behavior. This level of detail is crucial for validating the new method against a theoretical benchmark.