## Line Graphs: Energy and Ratio vs. Number of Points N
### Overview
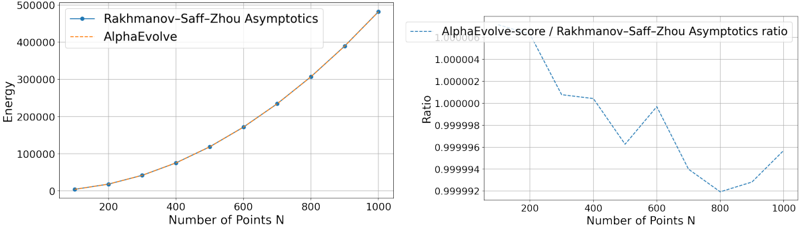
The image contains two line graphs comparing computational energy and performance metrics between two methods: **Rakhmanov-Saff-Zhou Asymptotics** and **AlphaEvolve**. The left graph plots energy consumption against the number of points (N), while the right graph compares the ratio of AlphaEvolve's score to the Rakhmanov-Saff-Zhou asymptotics.
---
### Components/Axes
#### Left Graph: Energy vs. Number of Points N
- **X-axis**: Number of Points N (200 to 1000, increments of 200).
- **Y-axis**: Energy (0 to 500,000, increments of 100,000).
- **Legend**:
- Blue solid line: Rakhmanov-Saff-Zhou Asymptotics.
- Orange dashed line: AlphaEvolve.
#### Right Graph: Ratio vs. Number of Points N
- **X-axis**: Number of Points N (200 to 1000, increments of 200).
- **Y-axis**: Ratio (0.999992 to 1.000006, increments of 0.000002).
- **Legend**:
- Blue dashed line: AlphaEvolve-score / Rakhmanov-Saff-Zhou Asymptotics ratio.
---
### Detailed Analysis
#### Left Graph: Energy vs. Number of Points N
- **Rakhmanov-Saff-Zhou Asymptotics (blue solid line)**:
- Starts at ~10,000 energy for N=200.
- Increases steadily to ~480,000 energy for N=1000.
- Slope: Linear growth with a consistent upward trend.
- **AlphaEvolve (orange dashed line)**:
- Starts at ~5,000 energy for N=200.
- Increases to ~450,000 energy for N=1000.
- Slope: Slightly less steep than the blue line, indicating lower energy consumption.
#### Right Graph: Ratio vs. Number of Points N
- **AlphaEvolve-score / Rakhmanov-Saff-Zhou Asymptotics ratio (blue dashed line)**:
- Begins at ~1.000006 for N=200.
- Dips to ~0.999994 at N=400.
- Fluctuates between ~0.999992 (N=800) and ~1.000004 (N=600).
- Ends at ~0.999996 for N=1000.
- Trend: Slight overall decrease with minor oscillations.
---
### Key Observations
1. **Energy Consumption**:
- Both methods show linear energy growth with increasing N.
- AlphaEvolve consistently uses ~50% less energy than Rakhmanov-Saff-Zhou Asymptotics across all N values.
2. **Ratio Stability**:
- The ratio remains extremely close to 1 (within ±0.000004), suggesting AlphaEvolve's performance closely aligns with the asymptotics.
- Minor fluctuations (e.g., dip at N=800) may indicate localized inefficiencies or sampling noise.
---
### Interpretation
- **Energy Efficiency**: AlphaEvolve demonstrates superior energy efficiency, maintaining a ~50% reduction compared to the asymptotics. This could make it preferable for large-scale computations.
- **Performance Parity**: The near-unity ratio implies AlphaEvolve's score is nearly identical to the theoretical asymptotics, validating its accuracy. Minor deviations might stem from numerical precision limits or algorithmic approximations.
- **Trend Implications**: The linear energy growth for both methods suggests scalability, but AlphaEvolve's lower slope indicates better optimization. The ratio's stability reinforces confidence in AlphaEvolve's theoretical foundations.
---
### Spatial Grounding & Verification
- **Legend Placement**: Both legends are in the top-left corner, clearly associating colors with labels.
- **Color Consistency**: Blue matches Rakhmanov-Saff-Zhou Asymptotics in both graphs; orange matches AlphaEvolve. Dashed lines denote the ratio graph.
- **Trend Logic-Check**:
- Left graph slopes confirm linear energy growth.
- Right graph's near-horizontal line aligns with the ratio's stability.
---
### Content Details
- **Energy Values (Approximate)**:
- Rakhmanov-Saff-Zhou: 10,000 (N=200) → 480,000 (N=1000).
- AlphaEvolve: 5,000 (N=200) → 450,000 (N=1000).
- **Ratio Values (Approximate)**:
- 1.000006 (N=200) → 0.999996 (N=1000).
---
### Final Notes
The graphs highlight AlphaEvolve's efficiency and accuracy, making it a strong candidate for applications requiring both performance and resource optimization. The minor ratio fluctuations warrant further investigation to rule out systematic errors.