## Gauge Diagram: Sentiment Indicator
### Overview
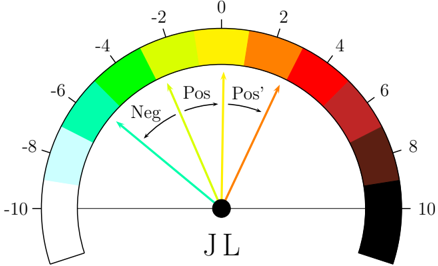
The image is a gauge diagram representing a sentiment indicator. It displays a semi-circular gauge with color-coded segments ranging from negative to positive values. Arrows indicate different sentiment levels: "Neg" (negative), "Pos" (positive), and "Pos'" (positive prime). The gauge ranges from -10 to +10.
### Components/Axes
* **Gauge Scale:** The gauge ranges from -10 on the left to +10 on the right. The scale is marked with numerical values at intervals of 2: -10, -8, -6, -4, -2, 0, 2, 4, 6, 8, 10.
* **Color Coding:** The gauge is color-coded to represent sentiment levels. From left to right, the colors transition from white to light blue, cyan, green, yellow, orange, red, dark red, brown, and black.
* **Arrows:** Three arrows originate from a central point labeled "JL".
* A cyan arrow labeled "Neg" points towards the negative side of the gauge.
* A yellow arrow labeled "Pos" points towards the positive side of the gauge.
* An orange arrow labeled "Pos'" points towards the positive side of the gauge, slightly to the right of the "Pos" arrow.
* **Labels:** The labels "Neg", "Pos", and "Pos'" indicate the direction and type of sentiment.
### Detailed Analysis
* **Negative Sentiment (Neg):** The cyan "Neg" arrow points approximately to the -6 mark on the gauge.
* **Positive Sentiment (Pos):** The yellow "Pos" arrow points approximately to the 0 mark on the gauge.
* **Positive Prime Sentiment (Pos'):** The orange "Pos'" arrow points approximately to the 2 mark on the gauge.
### Key Observations
* The gauge visually represents a spectrum of sentiment from negative to positive.
* The arrows indicate three different sentiment levels: negative, positive, and a slightly more positive sentiment.
* The "JL" label at the center likely represents the subject or entity being evaluated.
### Interpretation
The gauge diagram provides a visual representation of sentiment levels associated with "JL". The "Neg" arrow suggests a negative sentiment, while the "Pos" and "Pos'" arrows indicate varying degrees of positive sentiment. The diagram could be used to track changes in sentiment over time or to compare sentiment across different subjects. The relative positions of the arrows suggest that "JL" has both negative and positive associations, with a slightly stronger positive sentiment indicated by "Pos'".