\n
## Diagram: Color-Coded Scale with Vectors
### Overview
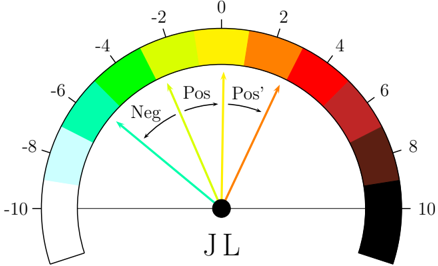
The image depicts a semi-circular color-coded scale ranging from -10 to 10, with three vectors originating from the center labeled "Neg", "Pos", and "Pos'". The scale appears to represent a continuous variable, with color indicating magnitude and potentially sign. The center of the scale is labeled "JL".
### Components/Axes
* **Scale:** A semi-circular arc spanning from -10 to 10. The scale is divided into color segments.
* **Color Gradient:** The color gradient transitions from light blue (-10) through green, yellow, and red to dark brown/black (10).
* **Vectors:** Three arrows originating from the center point "JL".
* "Neg" (light blue)
* "Pos" (yellow)
* "Pos'" (orange)
* **Center Point:** Labeled "JL" (black text).
* **Axis Markers:** Numerical values are placed along the arc at intervals of 2, from -10 to 10.
### Detailed Analysis
The color scale is as follows (approximate values based on visual estimation):
* -10: Light Blue
* -8: Cyan
* -6: Green
* -4: Lime Green
* -2: Yellow-Green
* 0: Yellow
* 2: Yellow-Orange
* 4: Orange
* 6: Red-Orange
* 8: Red
* 10: Dark Brown/Black
The vectors are positioned as follows:
* **Neg (Light Blue):** Points approximately towards -4 on the scale.
* **Pos (Yellow):** Points approximately towards +2 on the scale.
* **Pos' (Orange):** Points approximately towards +6 on the scale.
The vectors are not precisely aligned with the numerical markers, but their approximate positions can be estimated.
### Key Observations
* The color scale is symmetrical around 0, with cooler colors representing negative values and warmer colors representing positive values.
* The vectors "Pos" and "Pos'" both indicate positive values, but "Pos'" has a larger magnitude (further from the center).
* The vector "Neg" indicates a negative value.
* The label "JL" at the center of the diagram is not explained.
### Interpretation
This diagram likely represents a measurement or variable that can take on both positive and negative values. The color scale provides a visual representation of the magnitude and sign of the variable. The vectors "Neg", "Pos", and "Pos'" could represent different measurements or observations of this variable, or different components contributing to it. The "JL" label could represent a reference point, an initial value, or the name of the variable being measured.
The diagram suggests a system where values can range from -10 to 10, and the color coding allows for quick visual assessment of the magnitude and direction of the values. The three vectors indicate three distinct measurements or states within this system. The positioning of the vectors suggests that the "Pos'" measurement is the largest in magnitude, followed by "Pos", and then "Neg". Without further context, it is difficult to determine the specific meaning of the variable or the vectors.