## Semicircular Gauge: Value Indicator with Color-Coded Regions
### Overview
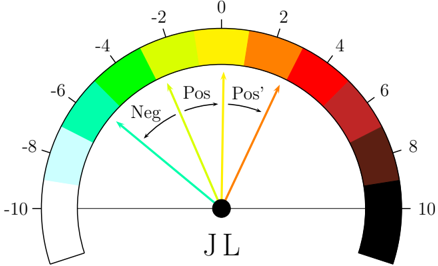
The image depicts a semicircular gauge with a color gradient from white (left) to black (right), labeled with numerical values from -10 to 10. Arrows labeled "Neg," "Pos," and "Pos'" point to specific regions, and a central black dot is labeled "JL."
### Components/Axes
- **Numerical Axis**:
- Values range from **-10 (left)** to **10 (right)** in increments of 2.
- Colors transition from **white (-10)** to **light blue (-8)**, **cyan (-6)**, **green (-4)**, **yellow (-2)**, **orange (0)**, **red (2)**, **dark red (4)**, **maroon (6)**, **black (8)**, and **darkest black (10)**.
- **Arrows**:
- **Cyan arrow ("Neg")**: Points to the leftmost region (-10 to -6).
- **Yellow arrow ("Pos")**: Points to the center (0).
- **Orange arrow ("Pos'")**: Points to the rightmost region (4 to 10).
- **Central Label**:
- "JL" is positioned at the center (black dot).
### Detailed Analysis
- **Color Gradient**:
- The left half (-10 to 0) uses cooler colors (white to yellow), while the right half (0 to 10) uses warmer colors (orange to black).
- The transition at **0** is marked by a sharp shift from yellow to orange.
- **Arrow Placement**:
- "Neg" spans the leftmost 4 units (-10 to -6).
- "Pos" targets the exact center (0).
- "Pos'" covers the rightmost 6 units (4 to 10).
- **Spatial Grounding**:
- Legend (color gradient) spans the entire semicircle, anchored at the bottom.
- Arrows originate from the center and extend outward, with "Neg" (cyan) on the left, "Pos" (yellow) vertical, and "Pos'" (orange) on the right.
### Key Observations
1. **Symmetry**: The gauge is symmetric around 0, with mirrored color intensity (e.g., -8 and 8 share similar brightness).
2. **Critical Zones**:
- "Neg" highlights extreme negative values (-10 to -6).
- "Pos'" emphasizes higher positive values (4 to 10).
3. **Ambiguity**: The label "Pos'" is unclear—it may denote a secondary positive threshold or a derivative value.
### Interpretation
This gauge likely represents a **dual-axis measurement system** where:
- **Negative values** (left) are associated with deficits or risks (e.g., financial loss, temperature drop).
- **Positive values** (right) indicate growth or thresholds (e.g., profit, temperature rise).
- The central "JL" could denote a **baseline reference** (e.g., "Justified Limit") or a critical operational point.
- The arrows suggest **priority regions**: "Neg" for urgent negative corrections, "Pos'" for high-value positive outcomes.
The design emphasizes **magnitude and directionality**, with color coding reinforcing the severity of deviations from zero. The lack of explicit units or context limits quantitative interpretation, but the structure implies a **threshold-based monitoring system**.