## Bar Chart: Computational Cost Comparison in LLaMA-13B
### Overview
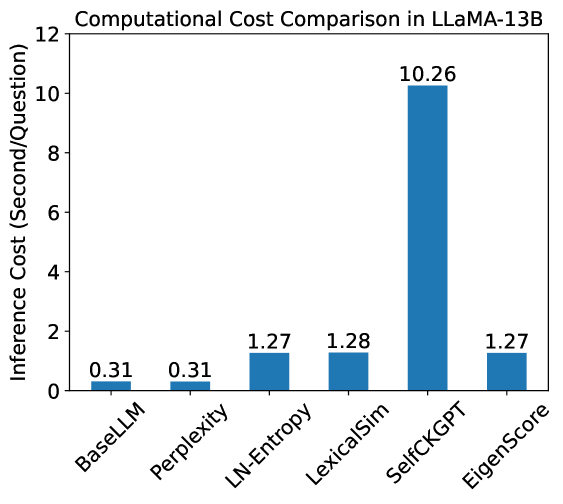
The image is a bar chart comparing the computational cost (inference cost in seconds per question) of different methods within the LLaMA-13B model. The x-axis represents the methods, and the y-axis represents the inference cost.
### Components/Axes
* **Title:** Computational Cost Comparison in LLaMA-13B
* **X-axis:**
* Labels: BaseLLM, Perplexity, LN-Entropy, LexicalSim, SelfCKGPT, EigenScore
* **Y-axis:**
* Label: Inference Cost (Second/Question)
* Scale: 0 to 12, with tick marks at intervals of 2 (0, 2, 4, 6, 8, 10, 12)
* **Bars:** Each bar represents a method, with the height indicating the inference cost. All bars are the same color (blue).
### Detailed Analysis
The chart displays the inference cost for each method. The values are as follows:
* **BaseLLM:** 0.31
* **Perplexity:** 0.31
* **LN-Entropy:** 1.27
* **LexicalSim:** 1.28
* **SelfCKGPT:** 10.26
* **EigenScore:** 1.27
### Key Observations
* SelfCKGPT has a significantly higher inference cost (10.26) compared to the other methods.
* BaseLLM and Perplexity have the lowest inference costs, both at 0.31.
* LN-Entropy, LexicalSim, and EigenScore have similar inference costs, around 1.27-1.28.
### Interpretation
The chart demonstrates that SelfCKGPT is computationally much more expensive than the other methods when used with LLaMA-13B. BaseLLM and Perplexity are the most efficient in terms of inference cost. The other methods (LN-Entropy, LexicalSim, and EigenScore) have similar, moderate inference costs. This suggests that SelfCKGPT might involve more complex calculations or require more resources during inference. The data highlights the trade-offs between different methods in terms of computational cost, which is an important consideration when deploying these models.