## Bar Chart: Computational Cost Comparison in LLaMA-13B
### Overview
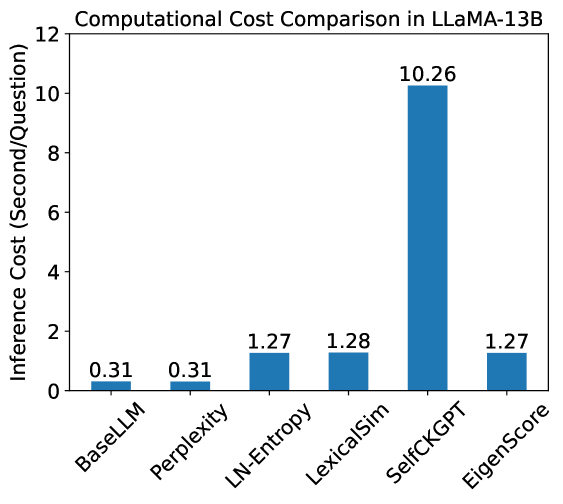
This image is a vertical bar chart titled "Computational Cost Comparison in LLaMA-13B." It compares the inference time (measured in seconds per question) across six different computational methods or model configurations. The chart highlights a significant disparity in computational requirements between the methods, with one specific method acting as a major outlier.
### Components/Axes
* **Title (Top-Center):** Computational Cost Comparison in LLaMA-13B
* **Y-Axis (Left):**
* **Label:** Inference Cost (Second/Question)
* **Scale:** Linear, ranging from 0 to 12 with major tick marks every 2 units (0, 2, 4, 6, 8, 10, 12).
* **X-Axis (Bottom):**
* **Categories:** Six distinct labels representing different methods, rotated approximately 45 degrees for readability.
* **Labels (Left to Right):** BaseLLM, Perplexity, LN-Entropy, LexicalSim, SelfCKGPT, EigenScore.
* **Data Series:** A single series represented by blue vertical bars. Each bar has its precise numerical value printed directly above it.
### Detailed Analysis
The data points are extracted as follows, moving from left to right along the X-axis:
| Category | Inference Cost (s/q) | Visual Trend Description |
| :--- | :---: | :--- |
| **BaseLLM** | 0.31 | Baseline level; very low bar. |
| **Perplexity** | 0.31 | Identical to BaseLLM; very low bar. |
| **LN-Entropy** | 1.27 | Significant increase from baseline; roughly 4x higher. |
| **LexicalSim** | 1.28 | Slightly higher than LN-Entropy; maintains the mid-tier plateau. |
| **SelfCKGPT** | 10.26 | Massive upward spike; the highest bar by a wide margin. |
| **EigenScore** | 1.27 | Sharp drop from the previous bar; returns to the mid-tier level. |
### Key Observations
* **Baseline Consistency:** BaseLLM and Perplexity share the exact same computational cost (0.31 s/q), suggesting that calculating Perplexity adds negligible overhead to the base model inference in this setup.
* **Mid-Tier Grouping:** LN-Entropy, LexicalSim, and EigenScore form a cluster of methods with similar costs, ranging from 1.27 to 1.28 s/q. These methods are roughly 4 times more expensive than the base model.
* **Extreme Outlier:** SelfCKGPT is the most computationally intensive method by an order of magnitude. At 10.26 s/q, it is approximately 33 times more expensive than the BaseLLM and roughly 8 times more expensive than the mid-tier methods.
### Interpretation
The data demonstrates the trade-offs between different evaluation or processing methods for the LLaMA-13B model.
1. **Efficiency vs. Complexity:** Methods like LN-Entropy and EigenScore provide additional metrics or processing at a relatively modest cost (approx. +1 second per question).
2. **The Cost of Self-Checking:** The "SelfCKGPT" method likely involves a "self-checking" mechanism or multiple sampling passes (e.g., generating multiple responses and comparing them), which explains the dramatic 10.26 s/q cost. This suggests that while self-checking might improve accuracy or reliability, it comes with a prohibitive computational penalty for real-time applications.
3. **Optimization Potential:** The fact that EigenScore returns to the 1.27 s/q level suggests it is a more efficient alternative to SelfCKGPT if they are intended to serve similar purposes (such as uncertainty estimation or hallucination detection).
4. **Peircean Investigation:** The identical values for BaseLLM and Perplexity (0.31) might imply that the "BaseLLM" measurement already includes the forward pass necessary to compute perplexity, or that the overhead of the softmax layer for perplexity is effectively zero compared to the token generation time.