## Bar Chart: Computational Cost Comparison in LLaMA-13B
### Overview
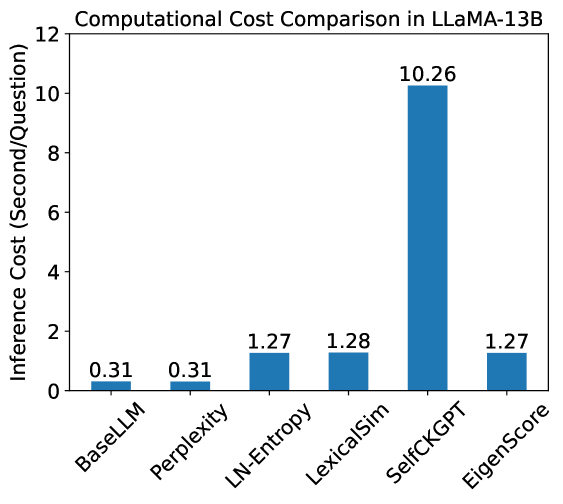
The chart compares the computational cost (inference time per question) of six methods used in LLaMA-13B. The y-axis represents inference cost in seconds per question, ranging from 0 to 12. The x-axis lists six methods: BaseLLM, Perplexity, LN-Entropy, LexicaSim, SelfCKGPT, and EigenScore. All bars are blue, with no legend present.
### Components/Axes
- **Title**: "Computational Cost Comparison in LLaMA-13B"
- **X-axis**: Categories (methods) labeled as:
- BaseLLM
- Perplexity
- LN-Entropy
- LexicaSim
- SelfCKGPT
- EigenScore
- **Y-axis**: "Inference Cost (Second/Question)" with increments at 0, 2, 4, 6, 8, 10, 12.
- **Bars**: Six vertical bars, each labeled with a numerical value above it.
### Detailed Analysis
- **BaseLLM**: 0.31 seconds/question (shortest bar).
- **Perplexity**: 0.31 seconds/question (tied with BaseLLM).
- **LN-Entropy**: 1.27 seconds/question.
- **LexicaSim**: 1.28 seconds/question.
- **SelfCKGPT**: 10.26 seconds/question (tallest bar, ~8x higher than LN-Entropy).
- **EigenScore**: 1.27 seconds/question (tied with LN-Entropy).
### Key Observations
1. **Outlier**: SelfCKGPT has a computational cost **~8x higher** than the next most expensive method (LN-Entropy/LexicaSim/EigenScore).
2. **Low-Cost Methods**: BaseLLM and Perplexity share the lowest cost (0.31s/question).
3. **Similarity**: LN-Entropy, LexicaSim, and EigenScore cluster tightly (1.27–1.28s/question).
4. **Scale Disparity**: SelfCKGPT’s bar is visually dominant, emphasizing its inefficiency.
### Interpretation
The data highlights **SelfCKGPT as a computational outlier**, suggesting it is significantly less efficient than other methods in LLaMA-13B. This could stem from architectural complexity, algorithmic overhead, or task-specific demands. The near-identical costs of LN-Entropy, LexicaSim, and EigenScore imply comparable efficiency, while BaseLLM and Perplexity represent the most resource-light approaches. The absence of a legend simplifies interpretation but limits contextual understanding of the methods’ purposes. The chart underscores trade-offs between computational cost and potential performance gains, critical for optimizing LLaMA-13B deployments in resource-constrained environments.