## Diagram: Bayesian Teaching for Recommendations
### Overview
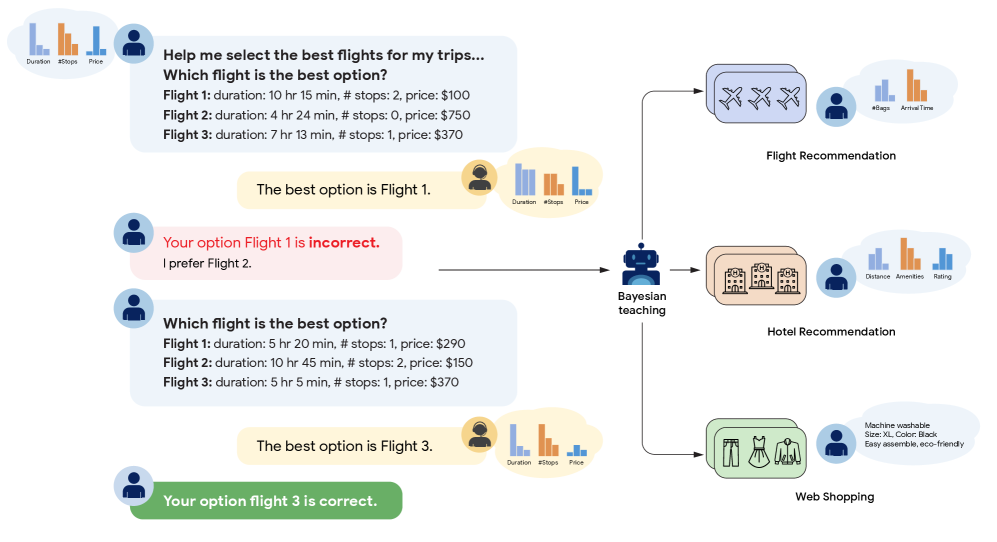
The image illustrates a Bayesian teaching system used for personalized recommendations across different domains: flight selection, hotel selection, and web shopping. The system learns from user feedback to improve its recommendations.
### Components/Axes
* **User Interaction Bubbles:** These represent user queries and feedback.
* Each bubble contains a question about selecting the best option (flight).
* Each bubble contains a list of options with attributes (duration, # stops, price).
* Each bubble contains the system's initial recommendation.
* Each bubble contains the user's feedback on the recommendation.
* **Bayesian Teaching Robot:** This represents the core learning algorithm. It receives user feedback and updates its model.
* **Recommendation Modules:** These represent the different domains where recommendations are made.
* Flight Recommendation: Shows airplanes and bar graphs for "#Bags" and "ArrivalTime".
* Hotel Recommendation: Shows buildings and bar graphs for "Distance", "Amenities", and "Rating".
* Web Shopping: Shows clothing items and text "Machine washable, Size: XL, Color: Black, Easy assemble, eco-friendly".
* **Bar Graphs:** Each recommendation module has associated bar graphs representing different features. The x-axis labels are specific to each module. The y-axis is not labeled, but represents the relative importance or value of each feature.
* **Flow Arrows:** Arrows indicate the flow of information from user interaction to the Bayesian teaching robot and then to the recommendation modules.
### Detailed Analysis
**User Interaction Bubbles (Flight Selection - First Instance):**
* **Query:** "Help me select the best flights for my trips... Which flight is the best option?"
* **Flight Options:**
* Flight 1: duration: 10 hr 15 min, # stops: 2, price: $100
* Flight 2: duration: 4 hr 24 min, # stops: 0, price: $750
* Flight 3: duration: 7 hr 13 min, # stops: 1, price: $370
* **System Recommendation:** "The best option is Flight 1."
* **User Feedback:** "Your option Flight 1 is incorrect. I prefer Flight 2."
* **Associated Bar Graph:**
* Duration: Tallest bar (blue)
* #Stops: Medium bar (orange)
* Price: Shortest bar (blue)
**User Interaction Bubbles (Flight Selection - Second Instance):**
* **Query:** "Which flight is the best option?"
* **Flight Options:**
* Flight 1: duration: 5 hr 20 min, # stops: 1, price: $290
* Flight 2: duration: 10 hr 45 min, # stops: 2, price: $150
* Flight 3: duration: 5 hr 5 min, # stops: 1, price: $370
* **System Recommendation:** "The best option is Flight 3."
* **User Feedback:** "Your option flight 3 is correct."
* **Associated Bar Graph:**
* Duration: Shortest bar (blue)
* #Stops: Medium bar (orange)
* Price: Tallest bar (blue)
**Flight Recommendation Module:**
* **Features:** #Bags, Arrival Time
* **Bar Graph:**
* #Bags: Short bar (blue)
* ArrivalTime: Tall bar (orange)
**Hotel Recommendation Module:**
* **Features:** Distance, Amenities, Rating
* **Bar Graph:**
* Distance: Short bar (blue)
* Amenities: Tall bar (orange)
* Rating: Medium bar (blue)
**Web Shopping Module:**
* **Features:** (Implied from text) Machine washable, Size: XL, Color: Black, Easy assemble, eco-friendly.
* **No Bar Graph:** Instead, descriptive text is provided.
### Key Observations
* The Bayesian teaching system learns from user feedback to improve its recommendations.
* The system considers multiple factors (duration, # stops, price) when recommending flights.
* The system adapts its recommendations based on user preferences.
* The bar graphs represent the relative importance of different features in each domain.
### Interpretation
The diagram illustrates a personalized recommendation system that uses Bayesian teaching to learn from user feedback. The system aims to provide relevant recommendations across different domains by considering multiple factors and adapting to user preferences. The initial recommendation in the first flight selection instance is incorrect, but after receiving feedback, the system provides a correct recommendation in the second instance. This demonstrates the learning capability of the Bayesian teaching algorithm. The bar graphs provide a visual representation of the relative importance of different features in each domain, allowing users to understand the factors that influence the system's recommendations. The system is designed to be flexible and adaptable, allowing it to be used in a variety of domains.