\n
## Diagram: AI-Powered Recommendation System with User Feedback Loop
### Overview
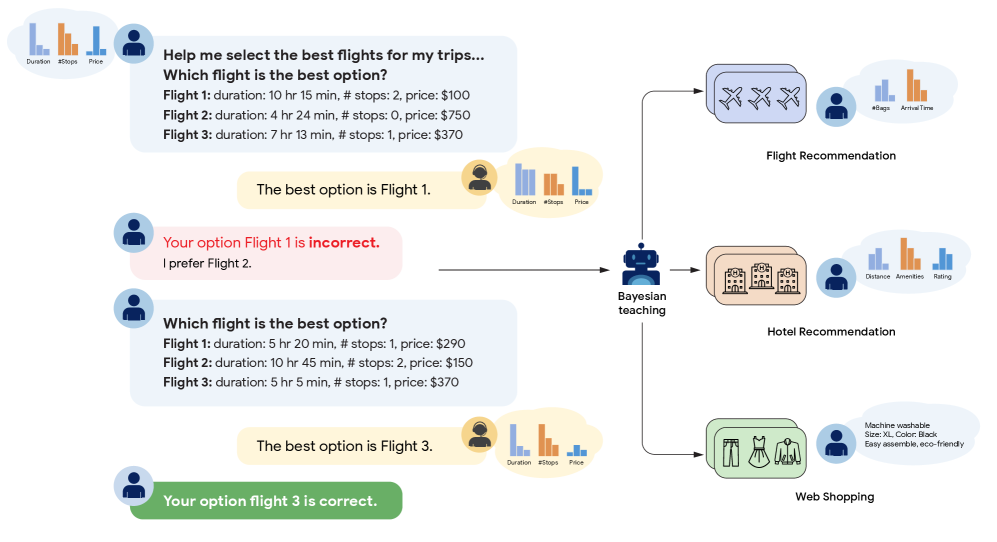
This diagram illustrates an AI-powered recommendation system that provides suggestions for flights, hotels, and web shopping items. The system incorporates a feedback loop where user choices are evaluated, and the AI (represented as a stylized human figure) adjusts its recommendations using Bayesian teaching. The diagram shows three distinct recommendation scenarios, each with user interaction and system response.
### Components/Axes
The diagram consists of the following key components:
* **User Profiles:** Represented by stylized human icons, indicating user interaction.
* **Recommendation Modules:** Three modules are depicted: "Flight Recommendation," "Hotel Recommendation," and "Web Shopping." Each module is associated with a set of icons representing the recommended items (airplane, hotel buildings, clothing/accessories).
* **Bar Charts:** Each recommendation module is linked to a bar chart displaying key attributes.
* **Flight Recommendation Charts:** X-axis labels: "Duration", "#Stops", "Price". Y-axis is not labeled, but represents relative values.
* **Hotel Recommendation Charts:** X-axis labels: "Distance", "Amenities", "Rating". Y-axis is not labeled, but represents relative values.
* **Web Shopping Charts:** X-axis labels: "Duration", "#Stops", "Price". Y-axis is not labeled, but represents relative values.
* **AI Agent:** A central figure representing the AI system, labeled "Bayesian teaching."
* **Arrows:** Indicate the flow of information and feedback between the user, the AI agent, and the recommendation modules.
* **Text Boxes:** Contain the questions posed to the user, the system's recommendations, and the user's responses.
### Detailed Analysis or Content Details
**Scenario 1: Flight Recommendation (Top)**
* **Question:** "Help me select the best flights for my trips... Which flight is the best option?"
* **Flight Options:**
* Flight 1: duration: 10 hr 15 min, # stops: 2, price: $100
* Flight 2: duration: 4 hr 24 min, # stops: 0, price: $750
* Flight 3: duration: 7 hr 13 min, # stops: 1, price: $370
* **System Recommendation:** "The best option is Flight 1."
* **User Response:** "Your option Flight 1 is incorrect. I prefer Flight 2."
**Scenario 2: Hotel Recommendation (Middle)**
* **Question:** "Which flight is the best option?" (Note: This appears to be a typo, should be "hotel")
* **Flight Options:** (Note: This appears to be a typo, should be "hotel")
* Flight 1: duration: 5 hr 20 min, # stops: 1, price: $290
* Flight 2: duration: 10 hr 45 min, # stops: 2, price: $150
* Flight 3: duration: 5 hr 5 min, # stops: 1, price: $370
* **System Recommendation:** "The best option is Flight 3." (Note: This appears to be a typo, should be "hotel")
* **User Response:** "Your option flight 3 is correct." (Note: This appears to be a typo, should be "hotel")
**Scenario 3: Web Shopping (Bottom)**
* **Question:** (No explicit question, implied recommendation)
* **Item Attributes:**
* Machine washable
* Size: XL
* Color: Black
* Easy assemble, eco-friendly
* **System Recommendation:** "The best option is Flight 3." (Note: This appears to be a typo, should be "item")
* **User Response:** "Your option flight 3 is correct." (Note: This appears to be a typo, should be "item")
**Bar Chart Analysis (General):**
The bar charts are used to visually represent the attributes of the recommended items. The height of each bar corresponds to the value of the attribute. The charts are positioned to the left of each recommendation module. The exact values are not provided, only relative comparisons can be made.
### Key Observations
* **Feedback Loop:** The diagram highlights the importance of user feedback in refining the AI's recommendations. The AI learns from incorrect choices and adjusts its strategy.
* **Bayesian Teaching:** The use of "Bayesian teaching" suggests that the AI employs a probabilistic approach to learning and updating its beliefs based on new evidence (user feedback).
* **Typographical Errors:** There are several instances of "Flight" being used when "Hotel" or "Item" is likely intended, suggesting a potential error in the diagram's creation.
* **Attribute Representation:** The bar charts provide a visual comparison of different attributes, allowing users to understand the trade-offs between different options.
### Interpretation
The diagram demonstrates a closed-loop AI recommendation system designed to learn user preferences and provide increasingly relevant suggestions. The system leverages Bayesian principles to update its model based on user feedback, improving its accuracy over time. The three scenarios (flights, hotels, web shopping) illustrate the system's versatility and applicability to different domains. The presence of typographical errors suggests a need for careful review and correction of the diagram's content. The diagram emphasizes the importance of incorporating user interaction and feedback into AI-powered recommendation systems to enhance their effectiveness and user satisfaction. The system is designed to adapt to individual user preferences, moving beyond simple rule-based recommendations to a more personalized and intelligent approach.