## Flowchart: Bayesian Teaching in Recommendation Systems
### Overview
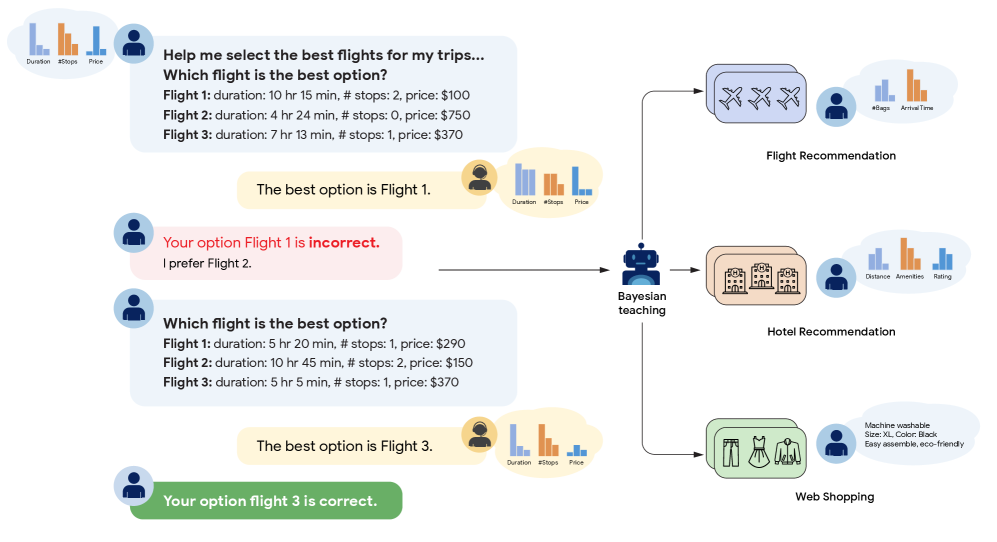
The diagram illustrates a conversational interaction between a user and a recommendation system, demonstrating how Bayesian teaching refines suggestions across three domains: Flight Recommendation, Hotel Recommendation, and Web Shopping. The system uses color-coded feedback (yellow: correct, pink: incorrect, green: correct) to iteratively improve its recommendations based on user preferences.
---
### Components/Axes
1. **Central Component**:
- **Bayesian Teaching**: A robotic figure labeled "Bayesian teaching" acts as the decision engine, connecting to all three recommendation domains via arrows.
- **User Interaction**: Speech bubbles represent user queries and system responses, with color-coded feedback.
2. **Recommendation Domains**:
- **Flight Recommendation**:
- Three flight options (Flight 1, 2, 3) with attributes:
- Duration (e.g., "10 hr 15 min"),
- Number of stops (e.g., "2 stops"),
- Price (e.g., "$100").
- Bar charts visualize duration, stops, and price for each flight.
- **Hotel Recommendation**:
- Attributes: Distance, amenities, rating.
- Bar charts compare these metrics.
- **Web Shopping**:
- Attributes: Machine-washable, size (XL), color (Black), ease of assembly, eco-friendliness.
- Product icons (clothing) represent these features.
3. **User Feedback**:
- Color-coded bubbles:
- **Yellow**: "Your option [X] is correct."
- **Pink**: "Your option [X] is incorrect. I prefer [Y]."
- **Green**: "Your option [X] is correct."
---
### Detailed Analysis
#### Flight Recommendation
- **First Query**:
- **Flight 1**: 10h15m, 2 stops, $100.
- **Flight 2**: 4h24m, 0 stops, $750.
- **Flight 3**: 7h13m, 1 stop, $370.
- User selects Flight 1 (yellow bubble). System corrects to Flight 2 (pink bubble).
- **Second Query**:
- **Flight 1**: 5h20m, 1 stop, $290.
- **Flight 2**: 10h45m, 2 stops, $150.
- **Flight 3**: 5h5m, 1 stop, $370.
- User selects Flight 3 (green bubble). System confirms correctness.
#### Hotel Recommendation
- Attributes visualized via bar charts:
- **Distance**: Shorter bars indicate closer proximity.
- **Amenities**: Number of amenities (e.g., pools, Wi-Fi).
- **Rating**: Star ratings (e.g., 4.5/5).
#### Web Shopping
- Product attributes:
- **Size**: XL (large).
- **Color**: Black.
- **Ease of Assembly**: "Easy" (simplified icon).
- **Eco-Friendliness**: "Eco-friendly" (leaf icon).
---
### Key Observations
1. **Iterative Learning**: The system adjusts recommendations based on user feedback (e.g., correcting Flight 1 to Flight 2).
2. **Attribute Prioritization**:
- Flights: Users prioritize shorter duration and fewer stops over price.
- Hotels: Proximity and amenities drive preferences.
- Web Shopping: Eco-friendliness and ease of use are critical.
3. **Color-Coded Feedback**: Yellow/green bubbles reinforce correct choices, while pink bubbles highlight suboptimal selections.
---
### Interpretation
The diagram demonstrates a **Bayesian teaching framework** where user feedback directly informs system adjustments. By analyzing preferences (e.g., favoring Flight 2 over Flight 1 despite higher cost), the system refines its model to align with user priorities. The flow from user input to system response and back creates a closed-loop learning process, emphasizing adaptability across domains.
Notably, the system’s ability to correct user choices (e.g., Flight 1 → Flight 2) suggests it incorporates cost-benefit analysis, balancing duration, convenience, and price. Similarly, the Web Shopping section highlights a shift toward sustainability (eco-friendly products) and practicality (easy assembly).
This structure underscores the importance of **context-aware recommendations** and the role of user feedback in optimizing decision-making systems.